

Key Takeaways:
-
Bitcoin dominance is the ratio of Bitcoin’s market cap to that of altcoins.
-
Bitcoin dominance is mainly influenced by introducing new potential altcoins, changing market trends, and stablecoin popularity.
-
Apart from providing a live feed of the number of coins in circulation and their prices, CoinGecko provides the market dominance charts of Bitcoin and some altcoins.
-
You can use the Bitcoin dominance chart to spot an altcoin season and monitor it alongside the BTC price to spot potential trends.
The crypto market is highly volatile, making it a potentially risky investment. As such, crypto traders and investors are relentlessly formulating various tools and indicators to monitor market trends and inform their investment decisions. Traders and investors follow Bitcoin dominance percentages closely to understand how cryptocurrency as a whole is performing and where it’s headed.
In this article, we will discuss what Bitcoin dominance is, the factors influencing Bitcoin dominance, how to read and use the Bitcoin dominance chart, and the “real” Bitcoin dominance index.
What is Bitcoin Dominance?
Bitcoin dominance is the ratio of Bitcoin’s market cap to that of alternative coins (altcoins). Altcoins are all other cryptocurrencies apart from bitcoin, where altcoins stand for “alternatives to BTC.” When you compare the BTC dominance ratio to that of other assets, you can gain more insights into the investment opportunities the present market condition provides. To understand Bitcoin’s dominance better, let’s have a quick refresher of what market capitalization (cap) is and its importance.
The market cap is the total value of the coins that are in circulation. You can calculate it by multiplying the number of coins in circulation by the current value of one coin. For instance, as of January 12, 2023, there are 19,259,768 bitcoins in circulation. Assuming the price of bitcoin is $18,113.81 then its market cap is 19,259,768 x $18,113.81 = $348,867,816,716 billion. In other words, the total value of all the circulating supply of bitcoin is just under $349 billion.

The $348.9 billion figure only makes sense once you compare it with the rest of the market. Comparing bitcoin’s market cap against the total crypto market cap will give you Bitcoin’s dominance ratio.

Generally, the total cryptocurrency market cap trend follows that of BTC. This is mainly because Bitcoin influences the whole crypto space as it’s the first, biggest, and most popular digital asset. By the way, the outside world (people who are not profoundly into crypto) think BTC is the only digital currency. I hope you aren’t part of them! Ha-ha.
Pro tip: CoinGecko provides a live feed of the number of coins in circulation and their prices. You can also compare the market cap of any coin or token against BTC and ETH.
What Factors Influence Bitcoin Dominance?
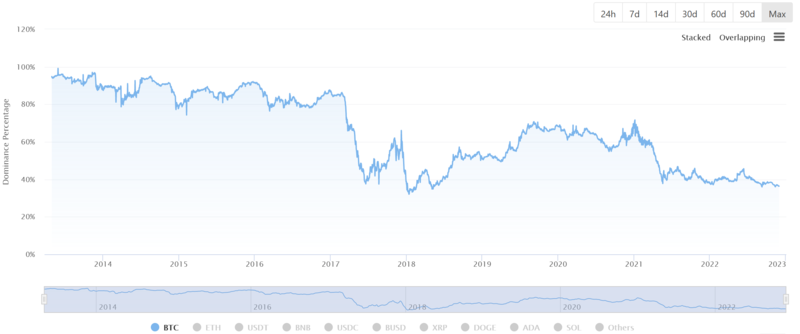
Before 2017, Bitcoin recorded a market dominance of above 80% – sometimes up to 95%. This is because there were few altcoins with a solid competitive edge. However, after the 2017 initial coin investment (ICO) run, altcoins led by Ethereum (ETH) started attracting substantial investment, reducing Bitcoin’s dominance.

From the above chart, when the ICO run went crazy in 2017, altcoin investment gained traction, and Bitcoin dominance fell to a low of 35%. At the start of 2018, Bitcoin dominance hit a high of almost 70%, as most of those altcoins went bust and vanished into thin air. In early 2021, Bitcoin dominance started to decline again as altcoin investment rallied following the negativity of Bitcoin’s energy use and China’s crypto mining ban. In recent times, Bitcoin’s dominance has been declining steadily since the onset of the current bear market.
Now let’s look at the factors affecting Bitcoin’s dominance more closely.
Changing Market Trends
As mentioned, before the crazy ICO run in 2017, Bitcoin’s dominance always stayed above 85%. Afterward, BTC shed a significant percentage of its dominance to high potential altcoins, like ETH and BNB, as these offered smart contract capabilities and EVM-compatibility.
The anonymous Bitcoin creator, Satoshi Nakamoto, invented it as a medium of exchange to serve as a decentralized alternative to traditional currencies. However, with the vast potential of blockchain technology, developers have created numerous cryptocurrency projects with unique characteristics. Some act as stores of value, while others offer their holders governance rights over the project through a DAO. There are also Non-fungible tokens (NFTs), which are unique crypto tokens representing real-world objects, such as art, music, real estate, in-game items, and more. Market trends can also lead to an increase in interest and investment in a particular crypto category.
Again, while there are more than 13,000 cryptocurrencies, Bitcoin has emerged as one of the most stable digital currencies. However, with so many options including low market cap tokens with potential, Bitcoin investors might choose to diversify their holdings to include these tokens, which may also cause a decline in Bitcoin dominance.
Stablecoin Popularity
Since 2018, there has been a growing demand for stablecoins (cryptocurrencies pegged 1:1 with the value of stable assets, like the US dollar or gold) – putting sustained pressure on Bitcoin dominance. Stablecoins like USDT and USDC also offer users an alternative on-ramp to the usual fiat-to-crypto exchanges, and with a surge of new funds entering the market through stablecoins instead of bitcoin, the total value of the crypto market increases and dilutes BTC dominance.
There is a strong demand for stablecoins, as they offer stability in the crypto market. Traders tend to convert their bitcoin and altcoin investments to stablecoins to maintain their profits, especially during bear markets (sustained periods of price downtrends) and periods of high volatility. Besides, to make it easier to enter and exit trades, traders often convert their profits to stablecoins in a bull market (sustained periods of price uptrends) instead of withdrawing their profits as fiat money.
Introduction of New Revolutionary Coins
Sometimes, introducing new coins with huge potential can draw the attention of Bitcoin investors, leading to a decline in BTC dominance. Remember, Bitcoin is “fighting” with over 13,000 cryptocurrencies. Therefore, introducing multiple altcoins with huge potential at once may impact its market dominance. Sometimes, these altcoins lose popularity after the hype is over. When this happens, investors move their funds from those coins back to bitcoin, leading it to regain its dominance.
How to Read the BTC Dominance Chart
The Bitcoin dominance chart is a graphic illustration of Bitcoin dominance as an index. Crypto traders started using the BTC dominance chart after the 2017 ICO run. But the chart gained more attention in 2021 during the altcoin boom. Currently, the Bitcoin dominance chart is one of the most prevalent trading tools in the crypto space.
Let’s learn how to read the Bitcoin dominance chart from CoinGecko.
Step 1
Navigate to CoinGecko’s global chart section.
Step 2
Scrawl down to the second chart titled “Bitcoin (BTC) Dominance Chart.”
The chart is set to 90 days by default, as shown below.

Apart from showing the market dominance of BTC, the chart contains the dominance of 10 altcoins, each with a different color for easy identification.
Step 3
Click on the bar labeled “Max” to view Bitcoin’s market dominance since its inception.

Step 4
Go to the bottom of the chart and uncheck the boxes of all the altcoins to remove their charts from view. This way, you will only remain with Bitcoin’s market dominance, as shown below.
You can zoom in on a particular period to have a closer view of Bitcoin’s dominance during that period.
Besides, you can compare Bitcoin’s dominance with any altcoin by checking its box. For example, click the ETH box to compare its dominance with that of bitcoin.

That’s how easy it is to read the Bitcoin dominance chart on CoinGecko!
How to Use the Bitcoin Dominance Chart
You can use the Bitcoin dominance chart to spot an altcoin season and monitor BTC price.
Spotting an Altcoin Season with Bitcoin Dominance
With the ever-growing number of altcoins in the crypto market, Bitcoin’s dominance has been declining. There are some periods when these altcoins have garnered more popularity, causing their total market cap to surpass that of BTC. Such periods are called “altcoin seasons” or “altseasons.” Investors tend to move their investments from BTC to altcoins during these periods.
Since altcoins often outperform BTC during altseasons, BTC’s dominance may shrink. As such, if you invest in Bitcoin and altcoins, you can monitor Bitcoin dominance to adjust your investments accordingly.
Monitoring the Current Bitcoin Price with Bitcoin Dominance
You can use Bitcoin dominance to track the price of bitcoin and make informed investment decisions. While they aren’t iron principles, below are some likely scenarios where the use of BTC dominance in monitoring BTC price signals a certain trend:
-
There can be an impending BTC bull run when Bitcoin’s dominance and price assume an upward trend.
-
When BTC’s price is on an upward trend, but its dominance is shrinking, it could indicate a potential altcoin season.
-
When BTC’s price is on a downward trend while its dominance is increasing, this could indicate the formation of an altcoin bear market.
-
A crypto bear market may loom when BTC’s price and dominance decline.
Although both factors don’t signal a definitive bull or bear market, past trends signal a strong correlation.
What is the “Real” Bitcoin Dominance Index?
The real BTC dominance index is the ratio of BTC’s market with that of other proof-of-work (PoW) cryptocurrencies that are operate as a form of currency, including Bitcoin (BTC) itself, Litecoin (LTC), Bitcoin SV (BSV), Bitcoin Cash (BCH), Monero (XMR), Dash (DASH), Zcash (ZEC), Bitcoin Gold (BTG), Dogecoin (DOGE), Decred (DCR), etc.
The formula for calculating real BTC dominance is:
Market cap of BTC divided by the (Market cap of BTC + Market cap of all PoW coins)
The logic behind the “Real” Bitcoin Dominance index is that many altcoins (such as stablecoins), aren’t competing with Bitcoin, and proponents can even opt to exclude Ethereum, as ETH can be seen as a utility token instead of a currency. This formula also disregards coins that are issued and regulated by centralized authorities, as they’re seen as deviating from Satoshi’s vision of decentralizing money as PoW is the only consensus mechanism that upholds the concept of decentralization. For users of the real BTC dominance index, if a cryptocurrency cannot uphold the concept of decentralization, then it offers little or no improvement to the traditional monetary system.
Conclusion
Bitcoin dominance is a great crypto trading tool that sheds more light on changing market trends. You can apply it to manage a diversified crypto portfolio or adjust your investment strategies based on trends. However, it’s important to point out that Bitcoin dominance doesn’t point out a definitive BTC or altcoin trend but acts as a tool that you can draw on to enable you to make informed investment decisions.
This article is provided for informational purposes and should not be taken as financial advice
Tell us how much you like this article!

Josiah Makori
Josiah is a tech evangelist passionate about helping the world understand Blockchain, Crypto, NFT, DeFi, Tokenization, Fintech, and Web3 concepts. His hobbies are listening to music and playing football.
Follow the author on Twitter @TechWriting001


Be the first to comment