

Elliott Wave Analysis TradingLounge Daily Chart,
VeChain/ U.S. dollar(VETUSD).
VET/USD Elliott Wave technical analysis
Function: Counter trend.
Mode: Corrective.
Structure: Flat.
Position: Wave ((C)).
Direction next higher degrees: Wave II of Impulse
Wave cancel invalid level: 0.2100
Details: Wave II Is equal 50% of Wave I at 0.0270
VeChain/U.S. dollar(VETUSD)Trading Strategy:
The short-term retracement of the second wave is likely to retest the 50% level of the first wave at 0.0270. We expect that the price is still likely to fall further, but only as a pullback. short term to continue Wait for the correction to complete to rejoin the uptrend.
VeChain/U.S. dollar(VETUSD)Technical Indicators: The price is above the MA200 indicating a Downtrend, The Wave Oscillator is a Bearish Momentum.
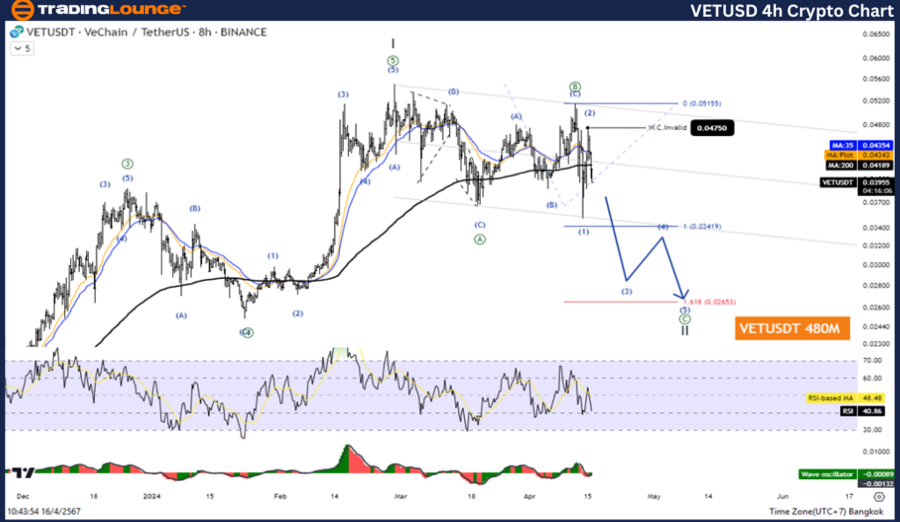
Elliott Wave Analysis TradingLounge 4H Chart,
VeChain/ U.S. dollar(VETUSD).
VET/USD Elliott Wave technical analysis
Function: Counter trend.
Mode: Corrective.
Structure: Flat.
Position: Wave ((C)).
Direction next higher degrees: Wave II of Impulse
Wave Cancel invalid Level:
Details: Wave C is equal to 161.8% of Wave A at 0.0265
VeChain/U.S. dollar(VETUSD)Trading Strategy:
The short-term retracement of the second wave is likely to retest the 50% level of the first wave at 0.0270. We expect that the price is still likely to fall further, but only as a pullback. short term to continue Wait for the correction to complete to rejoin the uptrend.
VeChain/U.S. dollar(VETUSD)Technical Indicators: The price is above the MA200 indicating a Downtrend, The Wave Oscillator is a Bearish Momentum.
Technical analyst: Kittiampon Somboonsod/


Be the first to comment