
Recent Polkadot price analysis reveals the cryptocurrency is continuing the downslide for the second day now. Polkadot got rejected from further upside when the price reached $4.33 yesterday, and the price started oscillating backward. As the DOT/USD price is stepping down, it may retest the support present at $4.25, which seems to be the closest for the bulls to fall on.
The digital asset is down by 0.04% in the last 24 hours, with a market capitalization of $4,977,910,399 and a 24-hour trading volume of $104,400,491. The overall sentiment in the market is bearish for Polkadot as the price continues to decline below the $4.33 level.
Polkadot price analysis: Recent updates
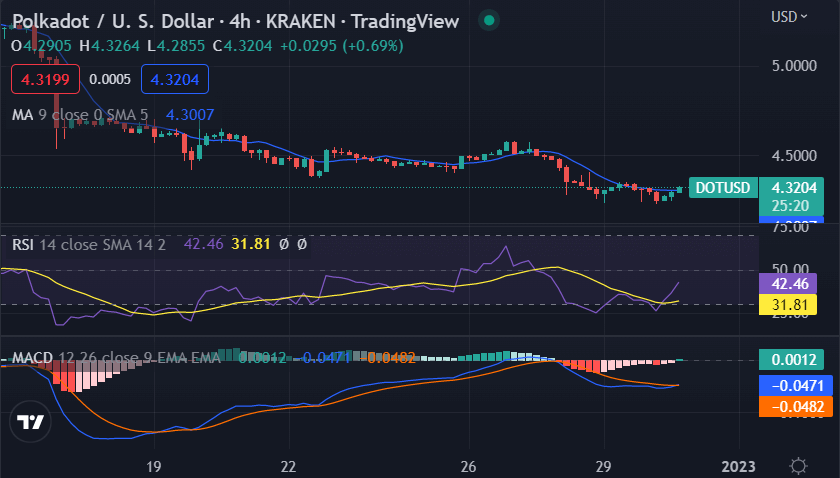
The 4-hour Polkadot price analysis shows that the price breakout was downwards at the start of today’s trading session, and the price stooped down to $4.32 during the first four hours. Bulls also uplifted the price at the start of the previous trading session, but the bearish pressure is overwhelming.

The 4-hour Moving average is currently at $4.30 which is supporting the downtrend, and the Relative Strength Index (RSI) is at 31.81, indicating that the asset is in a bearish state. The Moving average convergence/divergence (MACD) is still in the bearish zone and is continuing to move downwards, with the MACD line and signal line both trending downwards.
Polkadot price analysis 1-day price chart: DOT price reaches down to $4.32
The 1-day Polkadot price analysis shows that a further decrease in the price has been noted again today as the price has devalued to $4.32 at the time of writing. DOT/USD pair opened today’s trading session at $4.37, but the bears dragged the price down to $4.32 in the first few hours, and then it started oscillating around the same level.
The resistance for DOT/USD pair is present at $4.33, and the support is available near $4.25. The price of Polkadot is expected to stay below the resistance level in the following few hours, and if it breaks below the support then it could reach down to $4.15.

The RSI score of Polkadot is currently at 32.19, indicating that the asset is still in a bearish state, and the MACD is also in the bearish zone, with both the MACD line and signal line trending downwards. The moving average, indicators still suggest a bearish outlook for Polkadot in the short term.
Polkadot price analysis conclusion
The overall sentiment of Polkadot is bearish in the short term as the price continues to decline and oscillate between $4.25 and $4.33 levels. The buyers need to push the price above $4.32 in order to bring a bullish momentum, and if they fail then Polkadot could reach down to $4.15 in the upcoming few hours. The technical indicators suggest a bearish outlook for Polkadot in the short term, and investors should keep an eye on the price movements to get better insights.


Be the first to comment