

Polkadot (DOT) price has stagnated recently, failing to exhibit significant upward momentum. Instead, the prevailing bearish pattern suggests the likelihood of further declines in the near future.
This could dent the value of the altcoin, which is already taking a hit, pushing it farther away from being investors’ pick.
Polkadot Is Not Wanted
Different investors anticipate Polkadot’s price to rise and fall. However, the altcoin is seemingly responding to the bearish requests, which is evident in the supply metrics, particularly the Sharpe Ratio.
The Sharpe ratio measures the risk-adjusted return of an investment, indicating how much excess return an investment generates per unit of risk. A higher Sharpe ratio suggests better risk-adjusted performance.
On the other hand, a negative Sharpe Ratio means losses for the asset since the risk-adjusted returns are completely invalidated. This is the case with DOT, whose ratio is at -4.32, suggesting a lack of incentives for traders and investors.
Furthermore, the price indicators fail to signal a substantial rally. The Relative Strength Index (RSI) attempted to surpass the critical threshold at 50.0, indicating a potential shift in momentum, but regrettably retreated back into bearish territory.
Read More: What Is Polkadot (DOT)?
The RSI is a momentum oscillator that measures the speed and change of price movements, indicating overbought or oversold conditions. RSI values above 70 typically indicate overbought conditions, while values below 30 suggest oversold conditions.
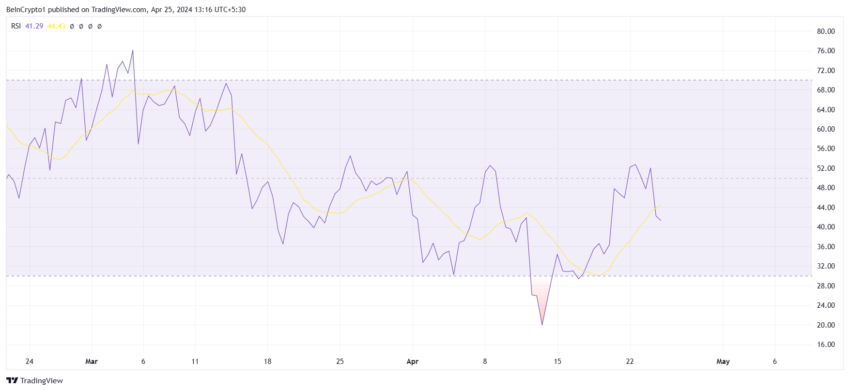
Although Polkadot’s price is far from being oversold, the failure to return above 50.0 is further a hint that, in the future, there will be a price decline.
DOT Price Prediction: More Downside Expected?
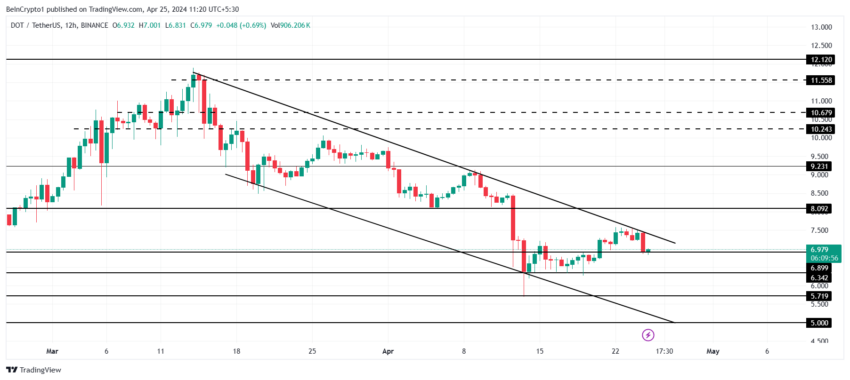
Polkadot’s price, trading at $6.9 at the time of writing, is struggling to maintain $7 as a support floor. Stuck within a descending channel, the altcoin shows relatively stronger resistance.
However, considering the aforementioned cues, DOT will likely fall through and hit the channel’s lower trend line. This line is marked at $5, and reaching the same would mark the lowest point for Polkadot in the last five months.
Read More: Polkadot (DOT) Price Prediction 2024/2025/2030
However, if the $7 support floor remains unbroken, Polkadot’s price could break down the channel. This would invalidate the bearish thesis. Consequently, it could set the altcoin up for additional gains to test $8 and $9 as resistance.
Disclaimer
In line with the Trust Project guidelines, this price analysis article is for informational purposes only and should not be considered financial or investment advice. BeInCrypto is committed to accurate, unbiased reporting, but market conditions are subject to change without notice. Always conduct your own research and consult with a professional before making any financial decisions. Please note that our Terms and Conditions, Privacy Policy, and Disclaimers have been updated.


Be the first to comment