

- Bitcoin, Ethereum prices rallied after US CPI data fell below expectations MoM, on January 12.
- Easing inflation indicates the Federal Reserve may reduce interest rate hikes, weighing on the US Dollar but helping Cryptocurrencies.
- Wednesday’s PPI release could have a similar impact if data shows a drop in ‘factory gate’ prices.
The release of the latest US Producer Price Index data, which measures factory gate price inflation, could significantly impact Bitcoin, Ethereum and other cryptocurrencies when it is released at 14:30 GMT on Wednesday, January 18. The econometric is seen as a forewarner of more general consumer price inflation since it measures the cost of goods after production, or the ‘wholesale’ price.
The PPI in C..
Bitcoin and Ethereum prices witnessed a recovery after the release of US CPI data on January 12 showed an unexpected -0.1% fall in December on a MoM basis. The data prompted a decline in the US Dollar and a rally in risk assets including many leading cryptocurrencies. This cancelled out losses from the FTX exchange collapse and DCG-Gemini scandal that have dogged the sector since November.
The question is, will the same thing happen when US PPI is released later today?And what exactly are the implications for cryptocurrencies from the data?.
Also read: Will US CPI release whipsaw Bitcoin price to $16,500?
US PPI and CPI over the years
Effect of PPI on the US Dollar and cryptocurrencies
PPI is expected to come out at 6.8% on a yearly basis and -0.1% on a monthly basis for December, based on surveys of economists.
The greatest impact on the US Dollar and cryptocurrencies will result from an unexpected rise in PPI. This is because market expectations are tilted towards expecting lower inflation including PPI, especially after December CPI showed an unexpected decline during the same month, therefore a rise would take the market by surprise.
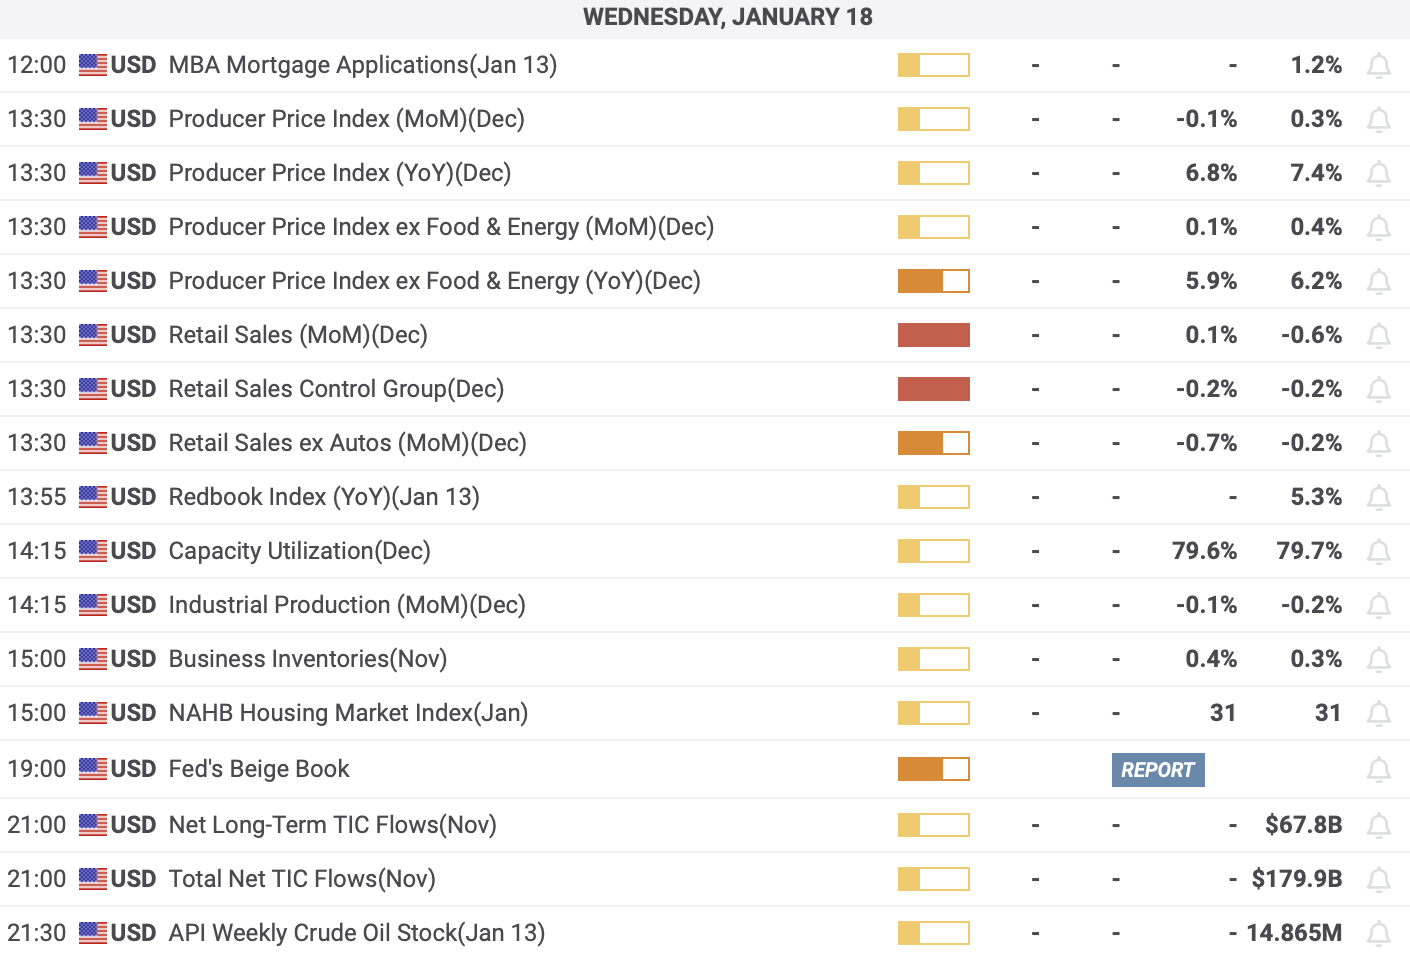
Important US economic data releases expected on Wednesday
If the reading is significantly higher than the consensus (more than 0.1% MoM or 0.2% YoY) then this could result in substantial rally in the US Dollar and fall in Bitcoin and other cryptocurrency prices. This is because it will mean the US federal Reserve may have to continue to implement aggressive interest rate hikes to curb inflation and this will support the US Dollar which is inversely correlated to cryptocurrencies (because they are priced in US Dollars).
If the PPI data meets consensus expectations, asset prices will probably remain largely unaffected, though there may be a slight positive impact on the US Dollar and negative impact on cryptocurrencies since the official survey expectations are now a bit out-of-date and do not factor in recent data, such as the below-expected CPI data released six days ago, on January 12.
A below-expectations result, especially if it is greater than the 0.1% divergence seen in the CPI release, would likely result in a fall in the value of the US Dollar and increase in Bitcoin, Ethereum and many other altcoin prices.
What is the Bitcoin chart saying before the release?
Bitcoin has risen sharply in January 2023, after plummeting to new lows following the FTX crisis last November. The leading crypto has risen from $15,479 on November 21 to a new high of $21,594 on Tuesday January 17 (yesterday).
There are indications the short-to-medium trend has changed for Bitcoin, after the break above the key November 5 high $21,473, the last lower high before BTC bottomed, achieved this week. This break is a major sign the broader downtrend could be reversing.
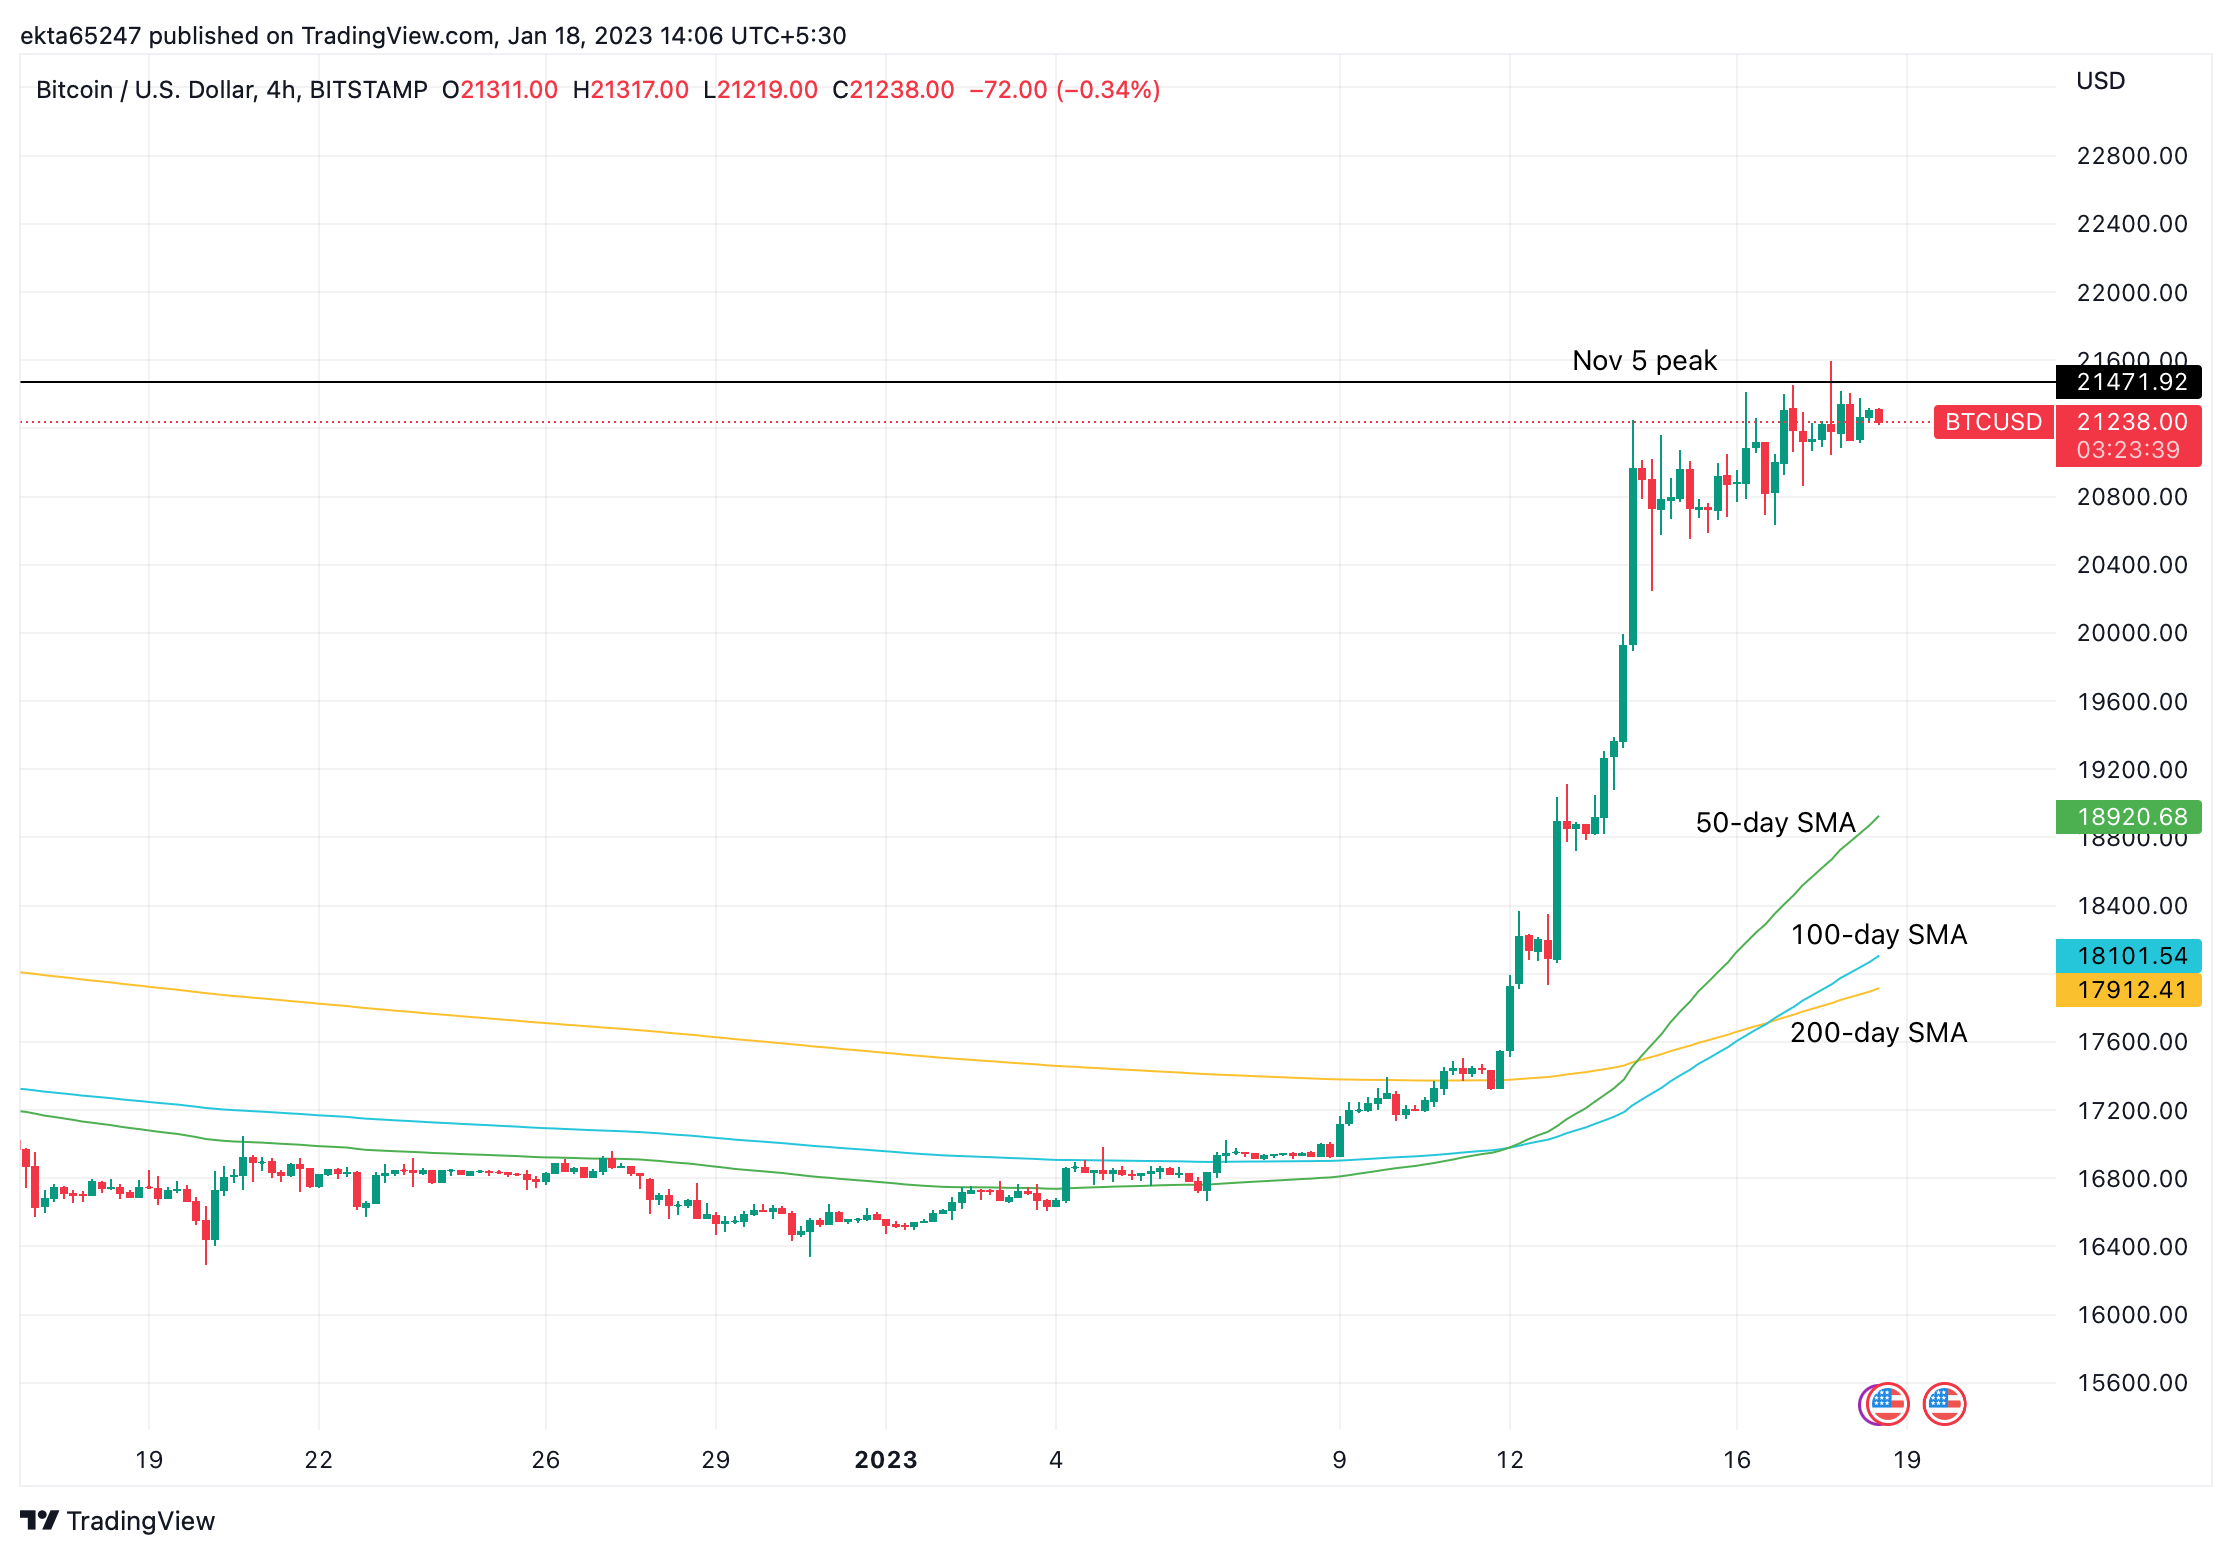
BTC/USD price chart
On its way up in January, Bitcoin price has broken above all the key moving averages: the 50, 100 and 200-day Simple Moving Averages (SMA), and this is further sign it could be reversing its longer-term downtrend.
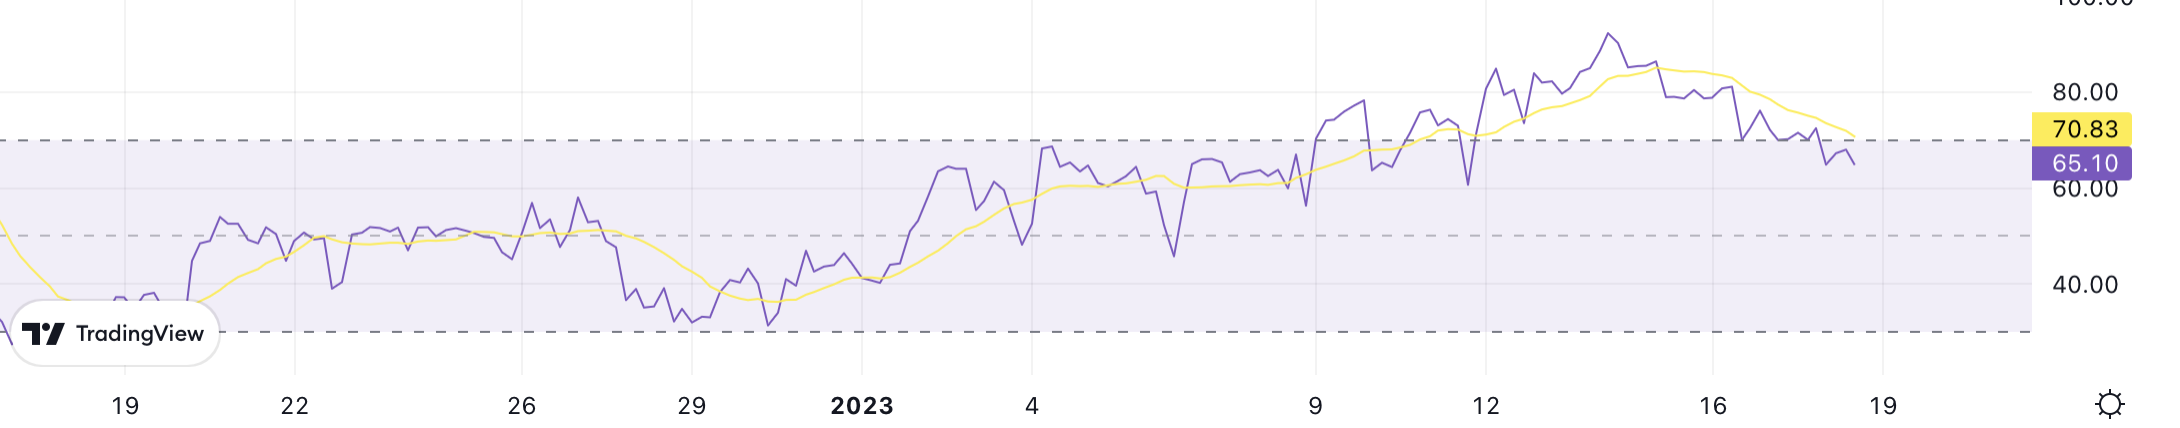
BTC is overbought, however, according to the Relative Strength Index (RSI) which is currently well above 70 on the daily chart. RSI can remain in overbought states for some time before the market starts pulling back and, according to Welles Wilder, the market technician who designed the indicator, it is not until it has exited overbought and re entered neutral territory, below 70, that a firm signal to sell can be inferred. Whilst it is in overbought, however, Wilder advised traders not to add to their longs. On the 4-hour chart above, however, the RSI has already fallen below 70, providing traders with a sell signal, and suggesting the possibility of a pullback on that timeframe.
A lower-than-anticipated or same-as-expected PPI, therefore, would certainly fall into line with the bullish narrative reflected in the charts, however, given the asset is already overbought, it could also have no effect or even a slightly bearish impact if the data continues to show lingering inflation. Prices rarely rise in a straight line and BTC price is certainly overdue a little correction.


Be the first to comment