
The Cardano (ADA) price has reached a descending resistance line in place since Aug. 2022. The line may cause a rejection. The Cardano news shows increased activity in the blockchain platform.
The Cardano news front was positive last week. The Decentralized Finance (DeFi) in the Cardano blockchain reached a two-month-high in terms of total value locked (TVL). Since the beginning of the year, the TVL has surged by 40%. However, it is still 79% below its all-time highs.
In other positive Cardano news, the Cardano foundation announced that it would be attending the World Economic Forum in Davos, organizing the panel “Blockchain for Good”.
Cardano Price Reaches Crucial Level
The Cardano price has decreased under a descending resistance line since May 10. While following it, the price fell to a low of $0.238 on Dec. 30. The ADA price has increased since.
During this period, the price validated the line four times (red icons), most recently on Jan. 14. Since lines get weaker each time they are touched, an eventual breakout from the line would be the most likely scenario. If that occurs, the next resistance would be at $0.425. This horizontal area is crucial since it has intermittently acted as both resistance and support for 247 days. As a result, the Cardano price has to reclaim this level in order for the trend to be considered bullish.
Technical indicators do not show signs of weakness yet. While the RSI is overbought, it has not generated any bearish divergence yet. Therefore, there are no signs that suggest the rally will end soon.
Will Rejection Lead to Retracement?
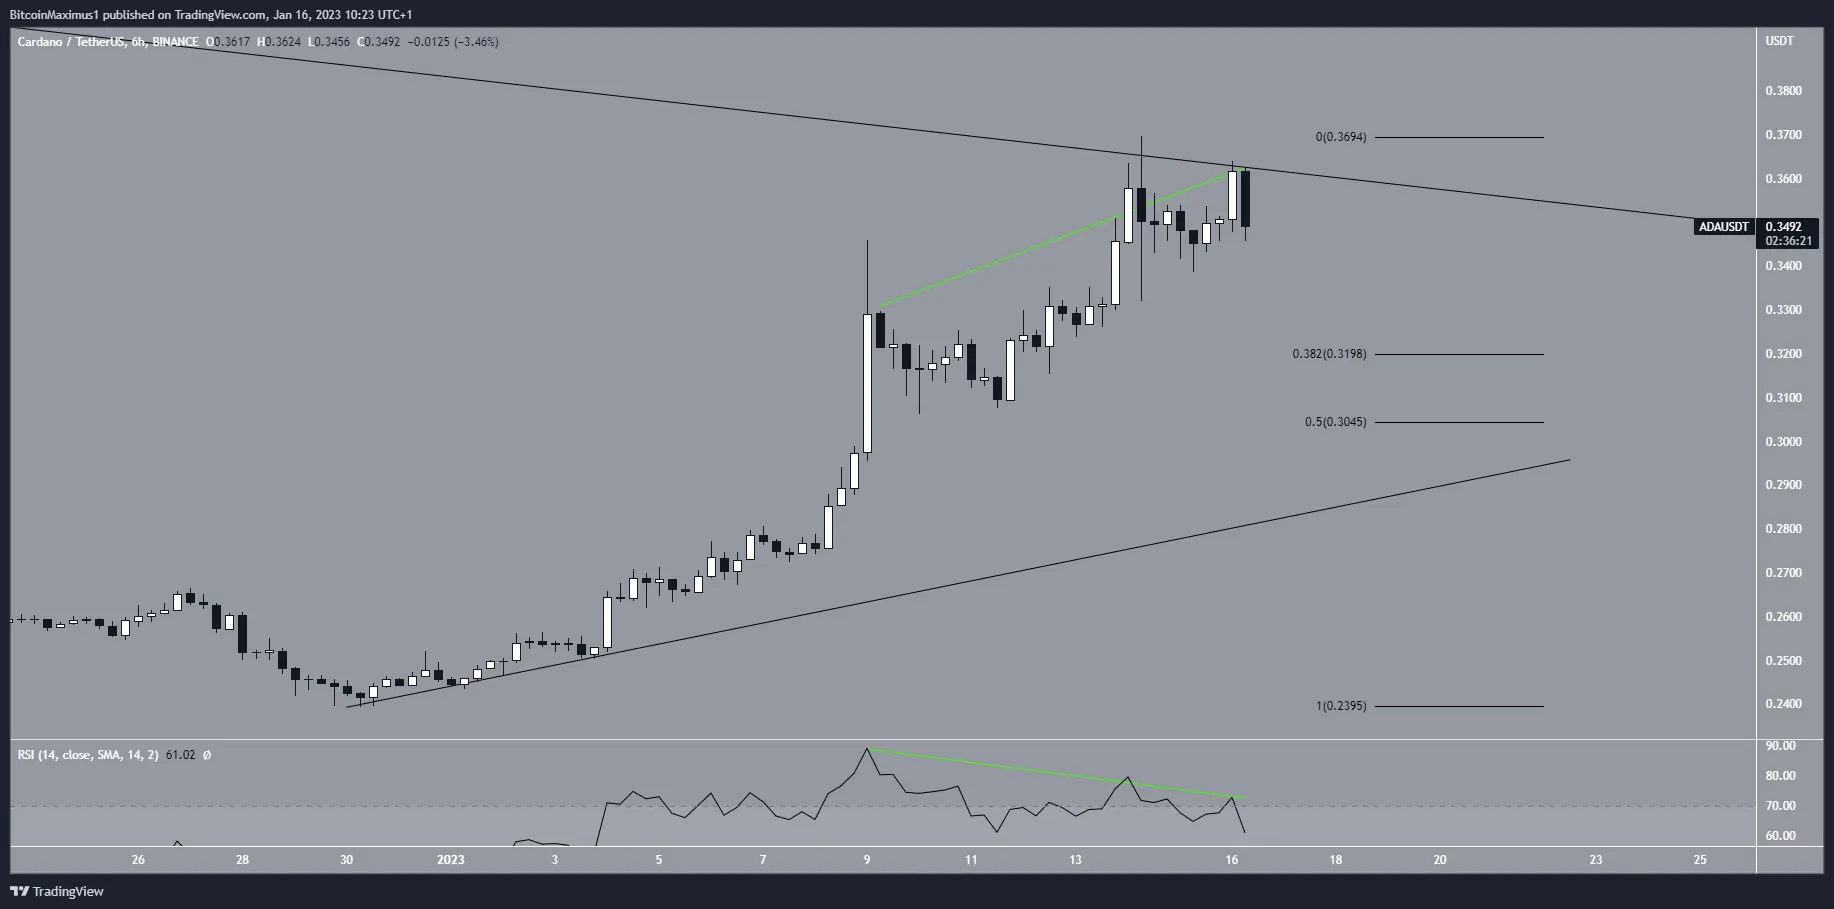
While the daily chart is bullish, the short-term six-hour one supports the possibility of a retracement before the continuation of the upward movement. The main reason for this is the bearish divergence created in the six-hour RSI (green line). The divergence occurring right at the long-term resistance line increases its significance.
If a downward movement follows it could begin during the next 24 hours. The two closest support levels would be at $0.320 and $0.305. These are created by the 0.382 and 0.5 Fib retracement levels, respectively.
Since the latter coincides with an ascending support line, it has more significance and better chances of initiating a bounce. A breakdown from the line would indicate that the entire upward movement is complete.
Conversely, a breakout from the long-term descending resistance line would invalidate this bearish Cardano short-term price forecast.
To conclude, while the technical analysis from the daily time frame gives a bullish ADA price forecast, the six-hour chart indicates that a retracement is expected before the upward movement continues. Conversely, a breakout from the long-term descending resistance line would mean that the retracement will not occur at all.
For BeInCrypto’s latest crypto market analysis, click here.
Disclaimer
BeInCrypto strives to provide accurate and up-to-date information, but it will not be responsible for any missing facts or inaccurate information. You comply and understand that you should use any of this information at your own risk. Cryptocurrencies are highly volatile financial assets, so research and make your own financial decisions.


Be the first to comment