

BNB price is attempting a fresh increase from the $550 zone. The price cleared the $600 resistance and might extend its increase above $630.
- BNB price started a fresh increase after it cleared the $550 resistance zone.
- The price is now trading above $580 and the 100 simple moving average (4 hours).
- There is a key bullish trend line forming with support at $592 on the 4-hour chart of the BNB/USD pair (data source from Binance).
- The pair could gain bullish momentum if it clears the $608-$610 resistance zone.
BNB Price Gains Strength
After forming a base above the $520 level, BNB price started a fresh increase. There was a steady increase above the $550 and $565 resistance levels, like Ethereum and Bitcoin.
The bulls pushed the price above the $580 pivot level and the 61.8% Fib retracement level of the downward wave from the $630 swing high to the $512 low. More importantly, the price is now trading above $580 and the 100 simple moving average (4 hours).
It is consolidating just above the 76.4% Fib retracement level of the downward wave from the $630 swing high to the $512 low. There is also a key bullish trend line forming with support at $592 on the 4-hour chart of the BNB/USD pair.
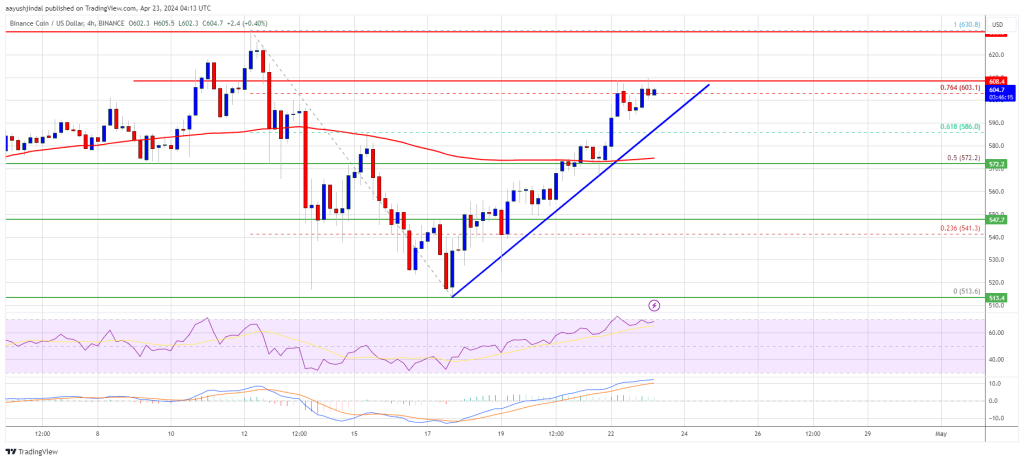
Source: BNBUSD on TradingView.com
Immediate resistance is near the $608 level. The next resistance sits near the $630 level. A clear move above the $630 zone could send the price further higher. In the stated case, BNB price could test $650. A close above the $650 resistance might set the pace for a larger increase toward the $680 resistance. Any more gains might call for a test of the $720 level in the coming days.
Are Dips Supported?
If BNB fails to clear the $608 resistance, it could start a downside correction. Initial support on the downside is near the $592 level and the trend line.
The next major support is near the $585 level. The main support sits at $570. If there is a downside break below the $570 support, the price could drop toward the $550 support. Any more losses could initiate a larger decline toward the $532 level.
Technical Indicators
4-Hours MACD – The MACD for BNB/USD is gaining pace in the bullish zone.
4-Hours RSI (Relative Strength Index) – The RSI for BNB/USD is currently above the 50 level.
Major Support Levels – $592, $585, and $570.
Major Resistance Levels – $608, $630, and $650.


Be the first to comment