
- BNB’s price started to go up after touching $565 on the charts
- Metrics and indicators hinted at a price uptick too
The latest market crash caused most altcoins to plummet by double-digits, but BNB acted differently. The altcoin seemed to hold its ground better than others, as it didn’t shed much of its market capitalization over the last 24 hours.
BNB outshines the rest
According to CoinMarketCap, the market crash did have an impact on BNB’s price as its value dropped by 4.5% in 24 hours. At the time of writing, the coin was trading at $593, with a market cap of over $88 billion.
Now, while the drop on the charts was sharp, BNB is still doing better than most top coins. For instance, Solana’s [SOL] price declined by over 11% while Dogecoin [DOGE] depreciated by more than 13%.
AMBCrypto’s analysis of Hyblock Capital’s data revealed that BNB’s liquidations rose sharply near $565. Soon after, the altcoin started to show signs of recovery as its price gained upward momentum, minimizing its 24-hour losses.
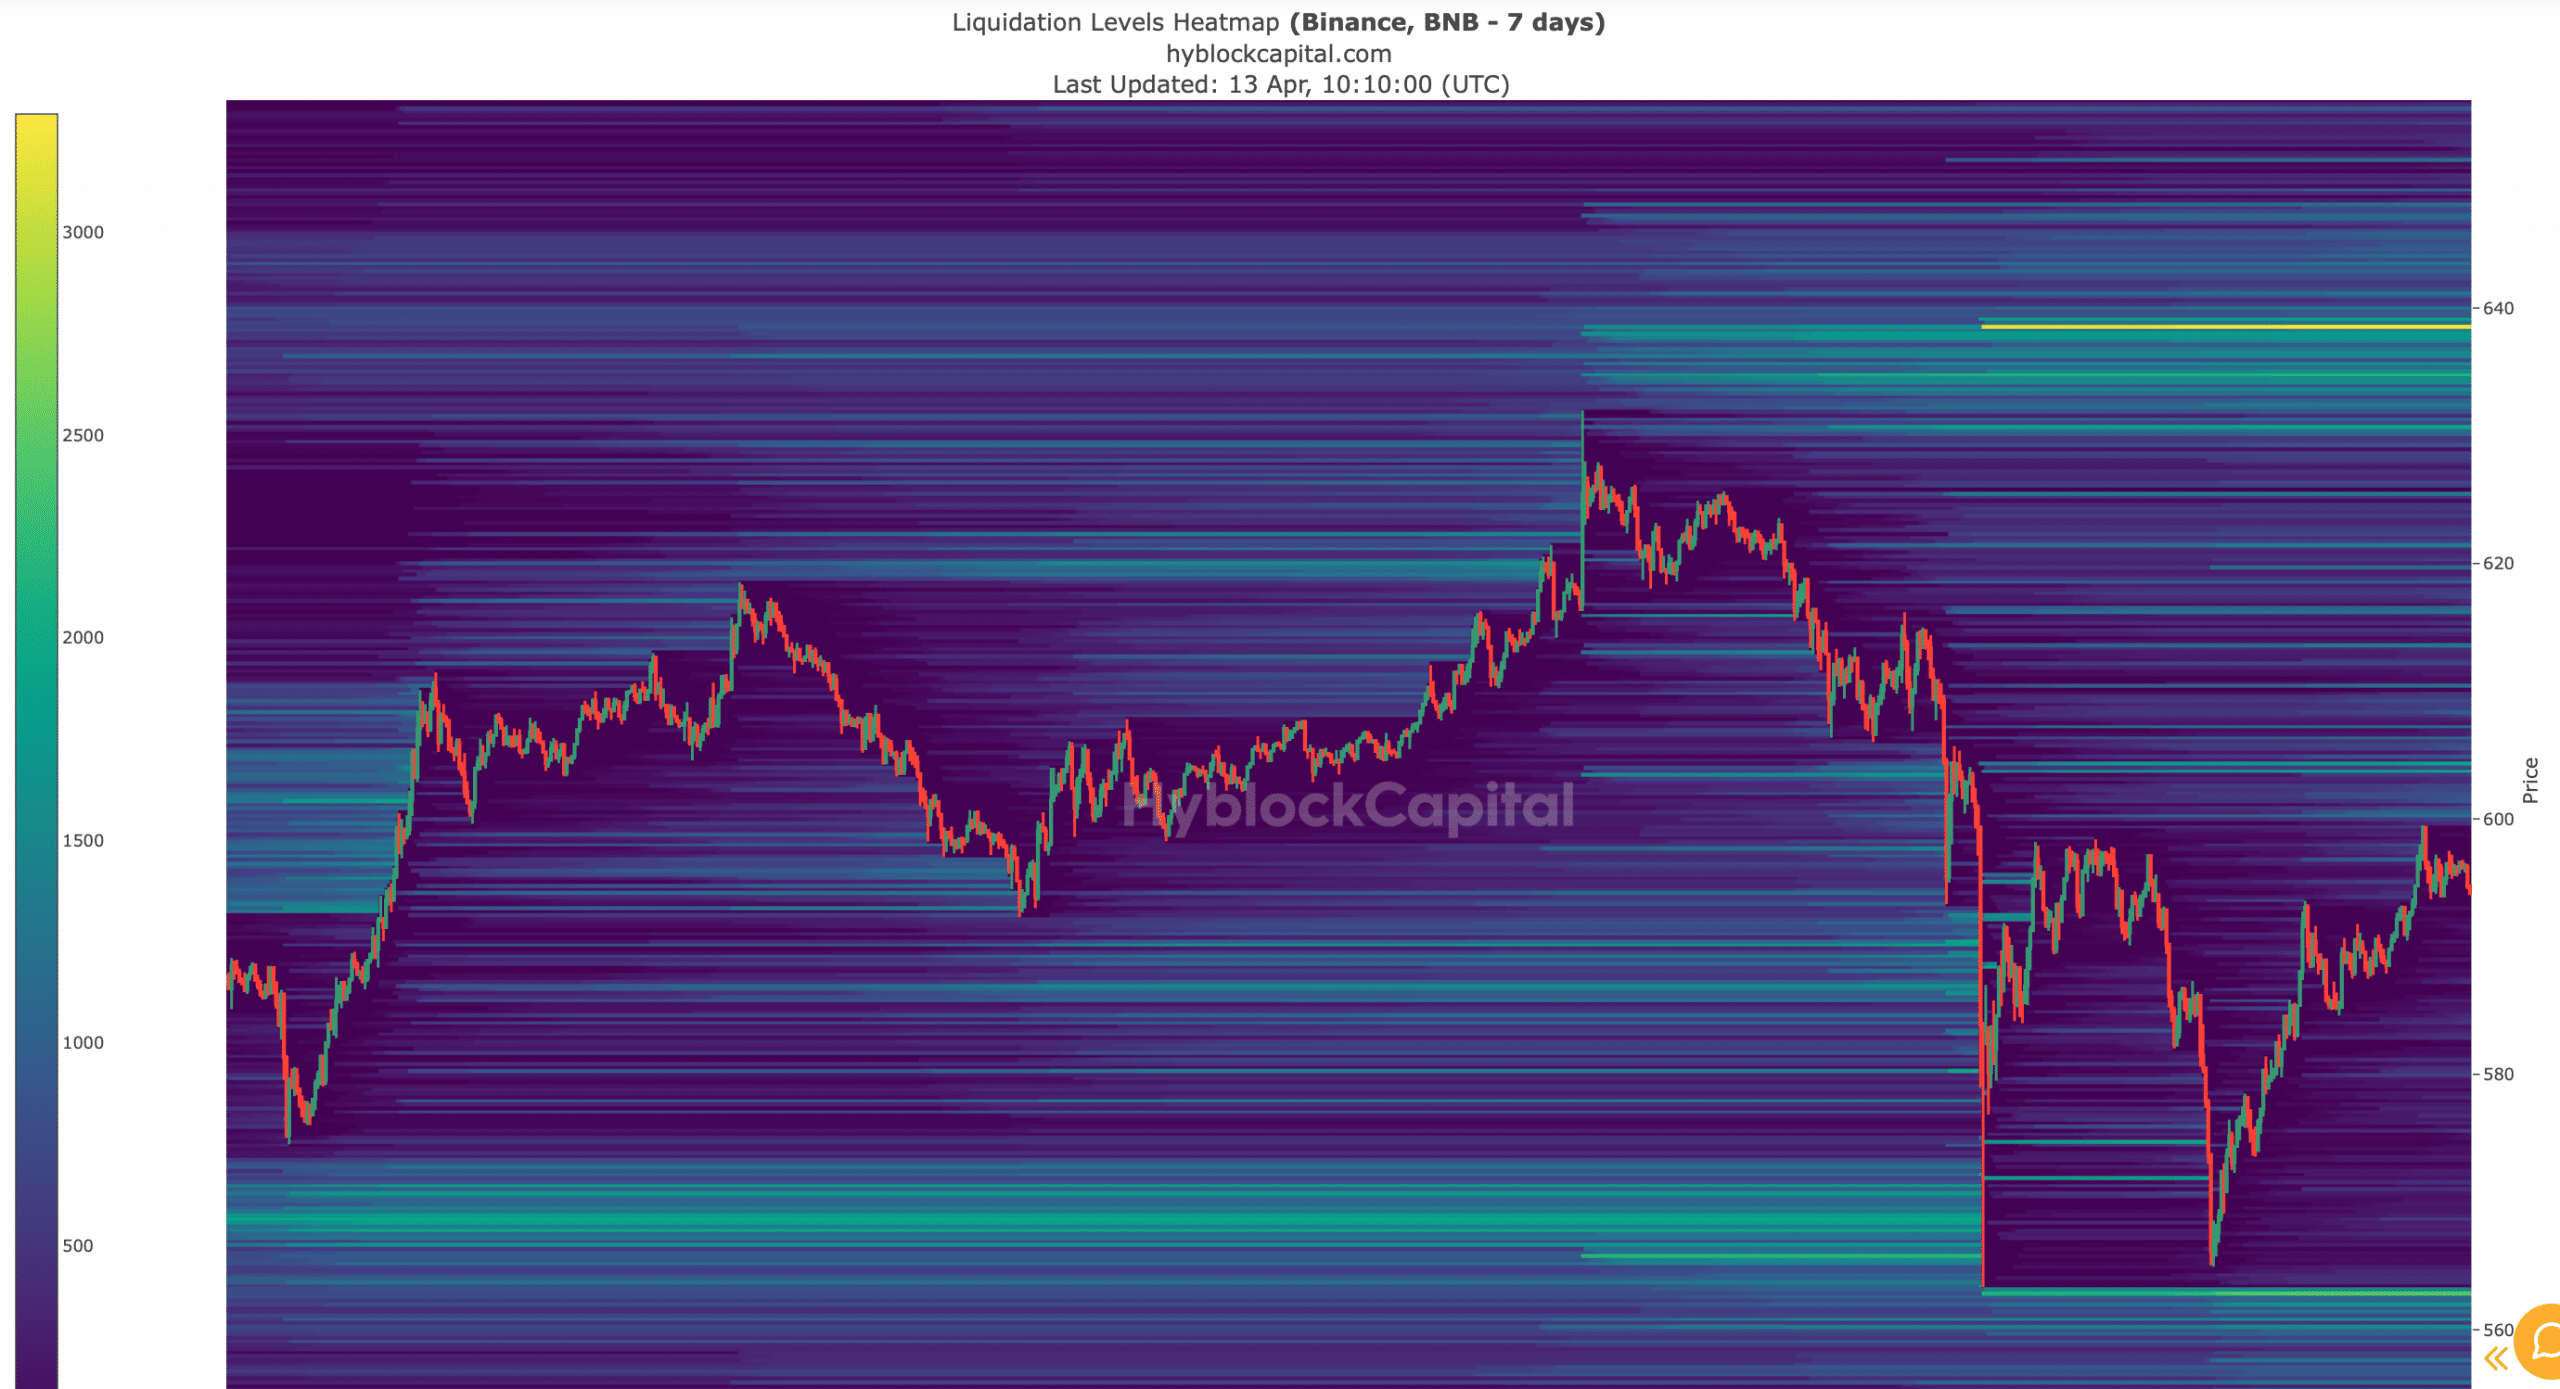
Source: Hyblock Capital
BNB’s 1-week price volatility also remained pretty low considering the market crash. This also indicated that the coin held its ground well and that its value did not sink to an extent that raised alarms.
Interestingly, while BNB’s price action turned bearish, investors’ confidence in the coin remained high. This was evidenced by the fact that BNB’s weighted sentiment graph spiked over the last few days.

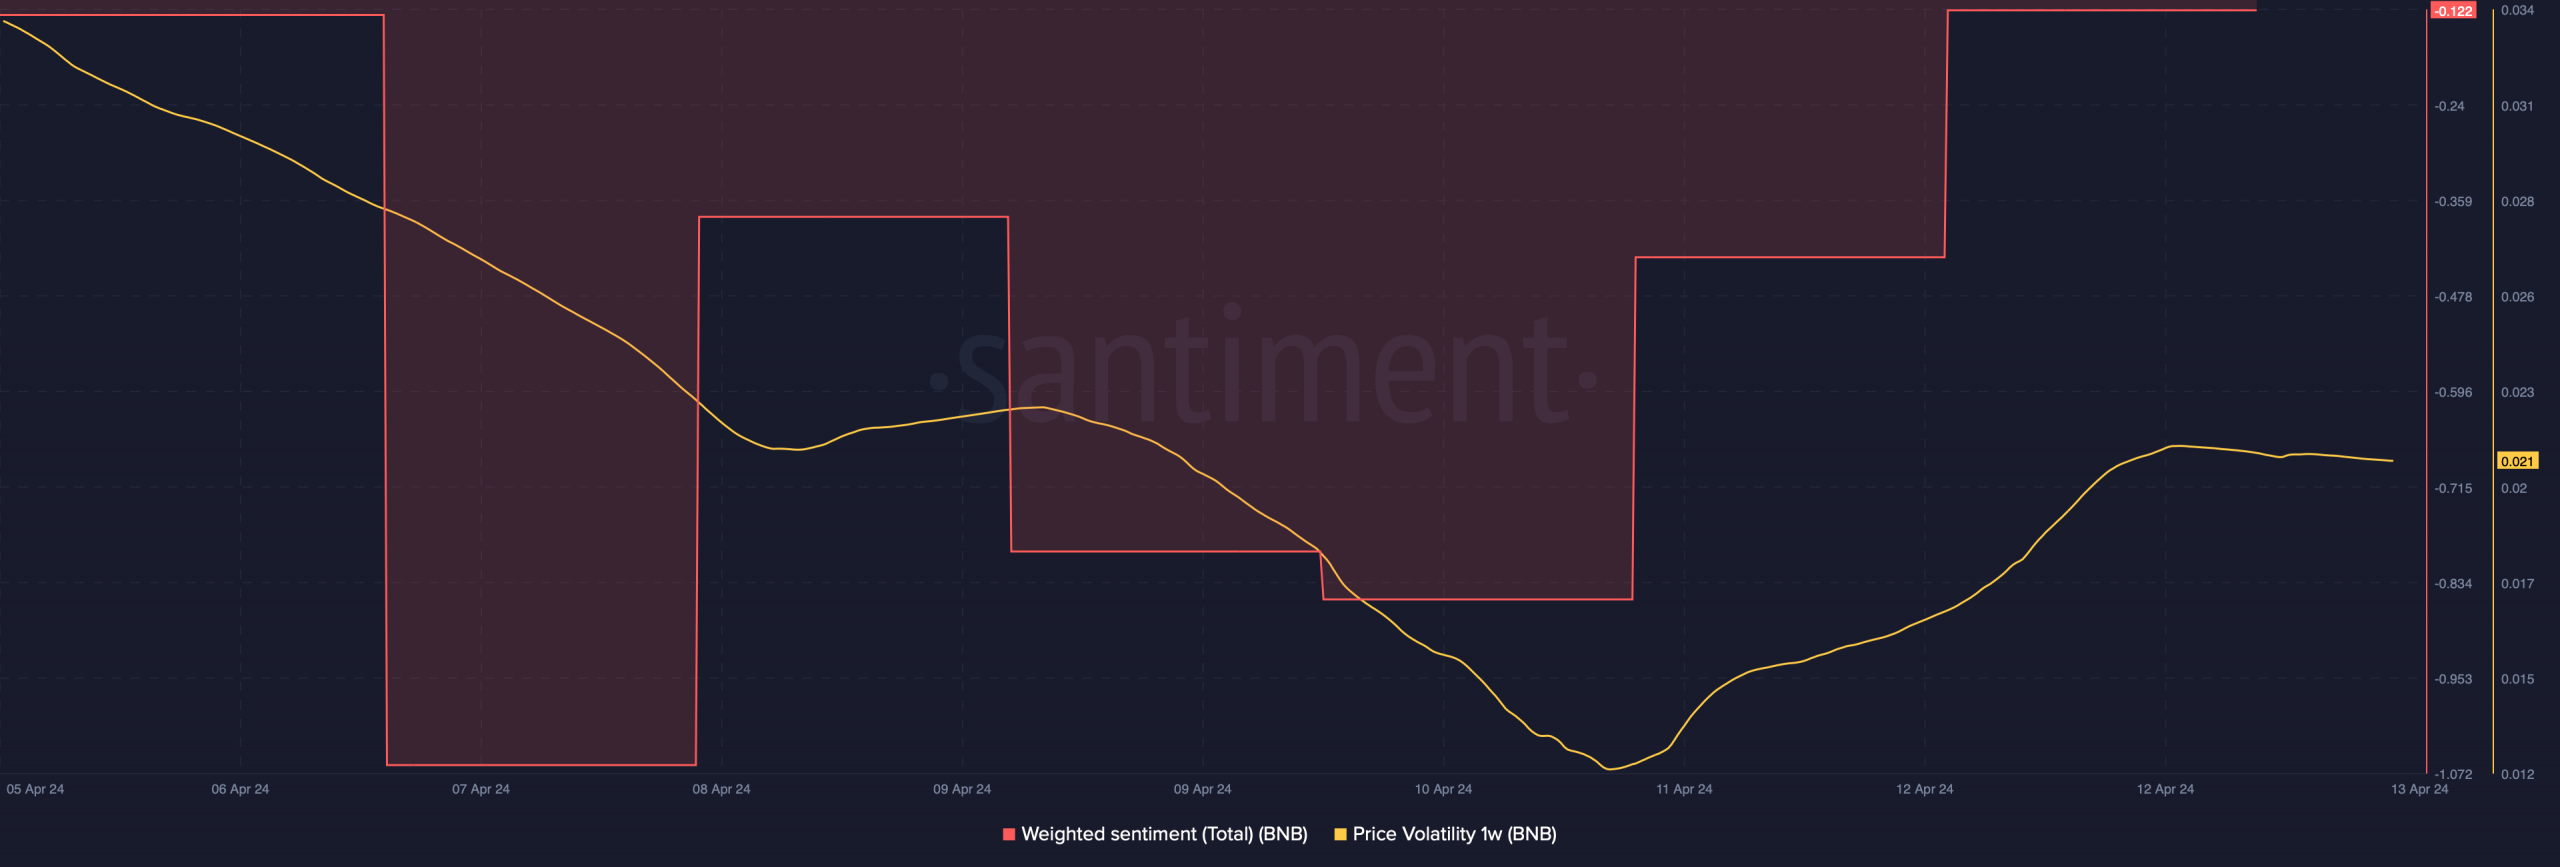
Source: Santiment
BNB might decouple from the market
Since BNB’s price didn’t drop much, there are signs that the coin might be the first crypto to recover from the bearish market. To see whether that’s possible, AMBCrypto analyzed Santiment’s data.
As per our analysis, BNB’s open interest started to hike over the last few hours, along with its price. A rise in the metric usually indicates that the chances of the ongoing price trend continuing are high. Additionally, BNB’s funding rate turned red. Generally, prices tend to move the other way than the funding rate. In this particular case, that means BNB is turning bullish.
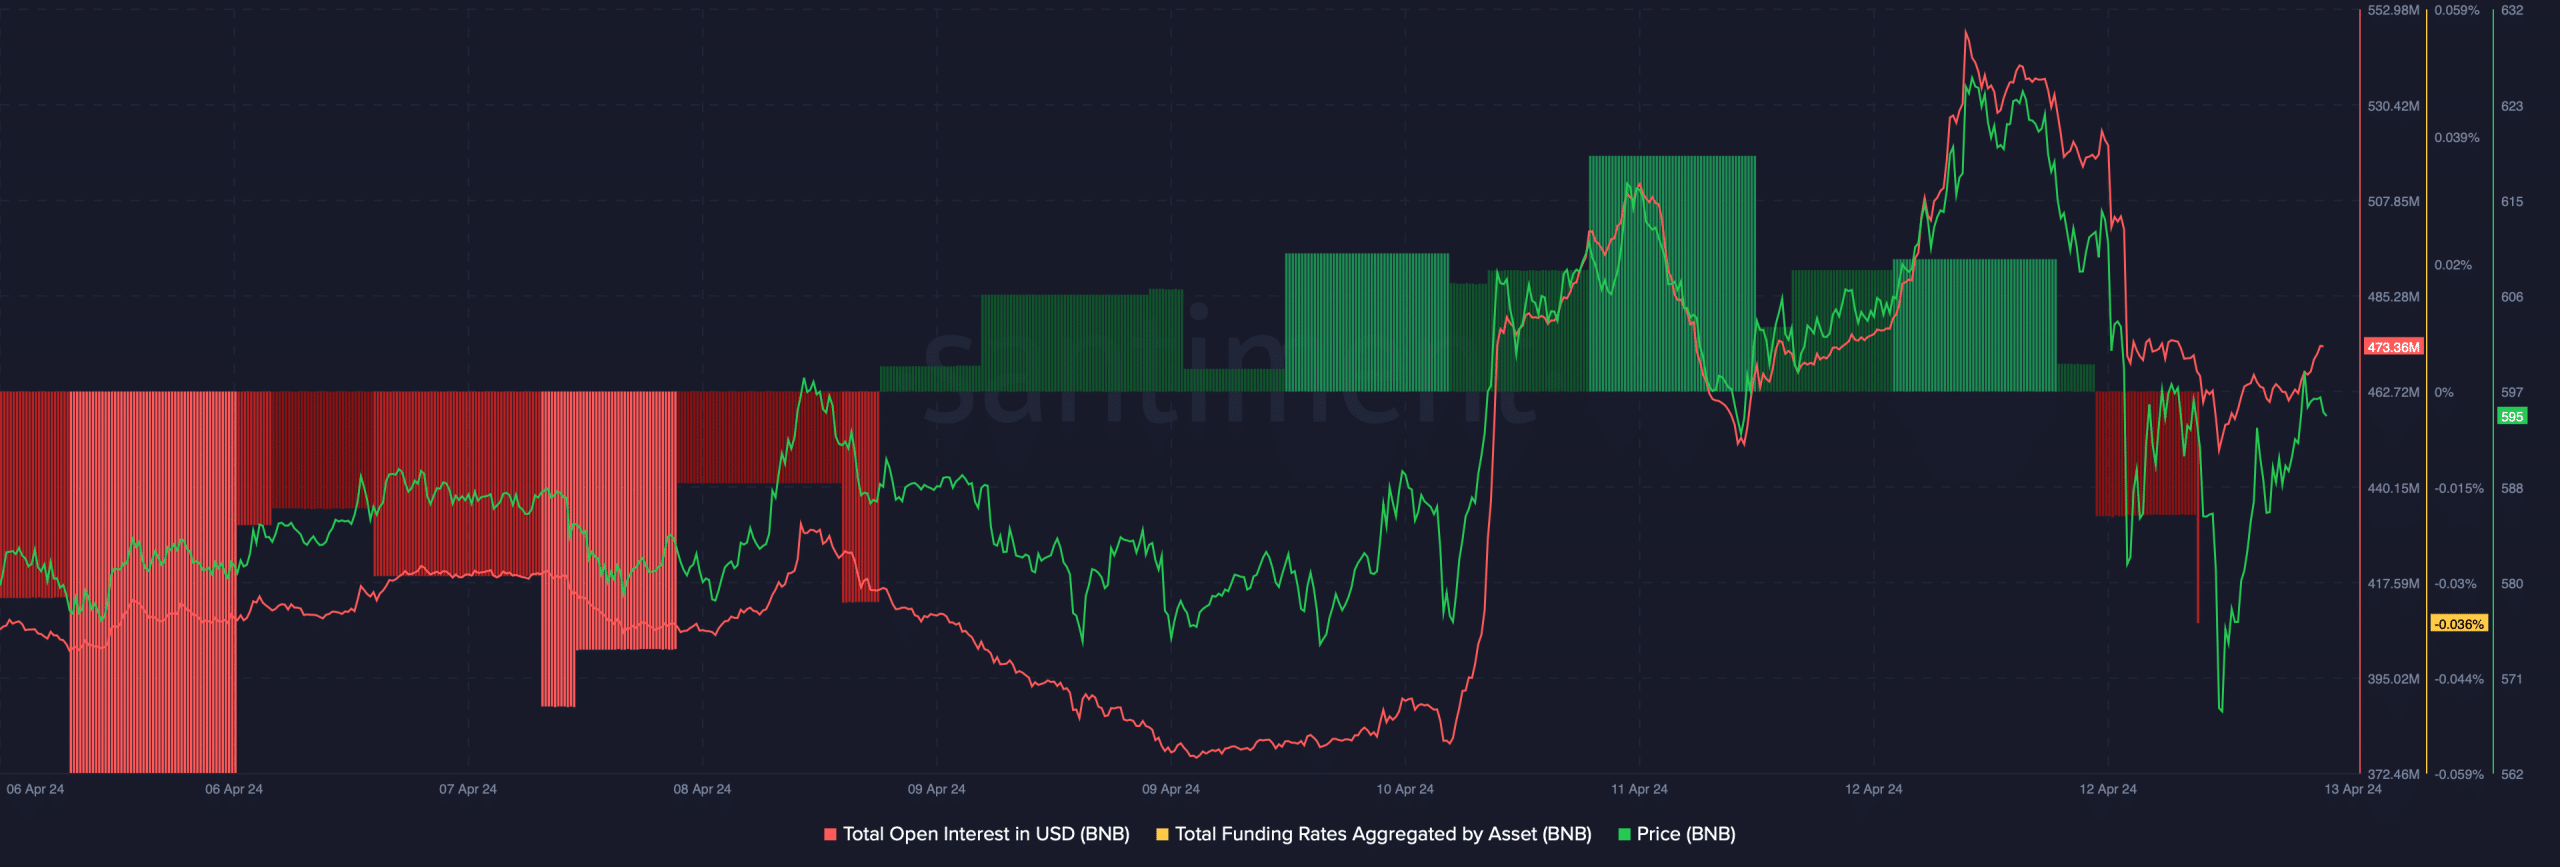
Source: Santiment
To better understand which way the coin may be heading, we then checked its daily chart. We found that the coin’s Relative Strength Index (RSI) was resting above neutral zone.
Moreover, the Chaikin Money Flow (CMF) also gained momentum as it went up, well above zero – A sign of capital flowing into Binance Coin’s market.

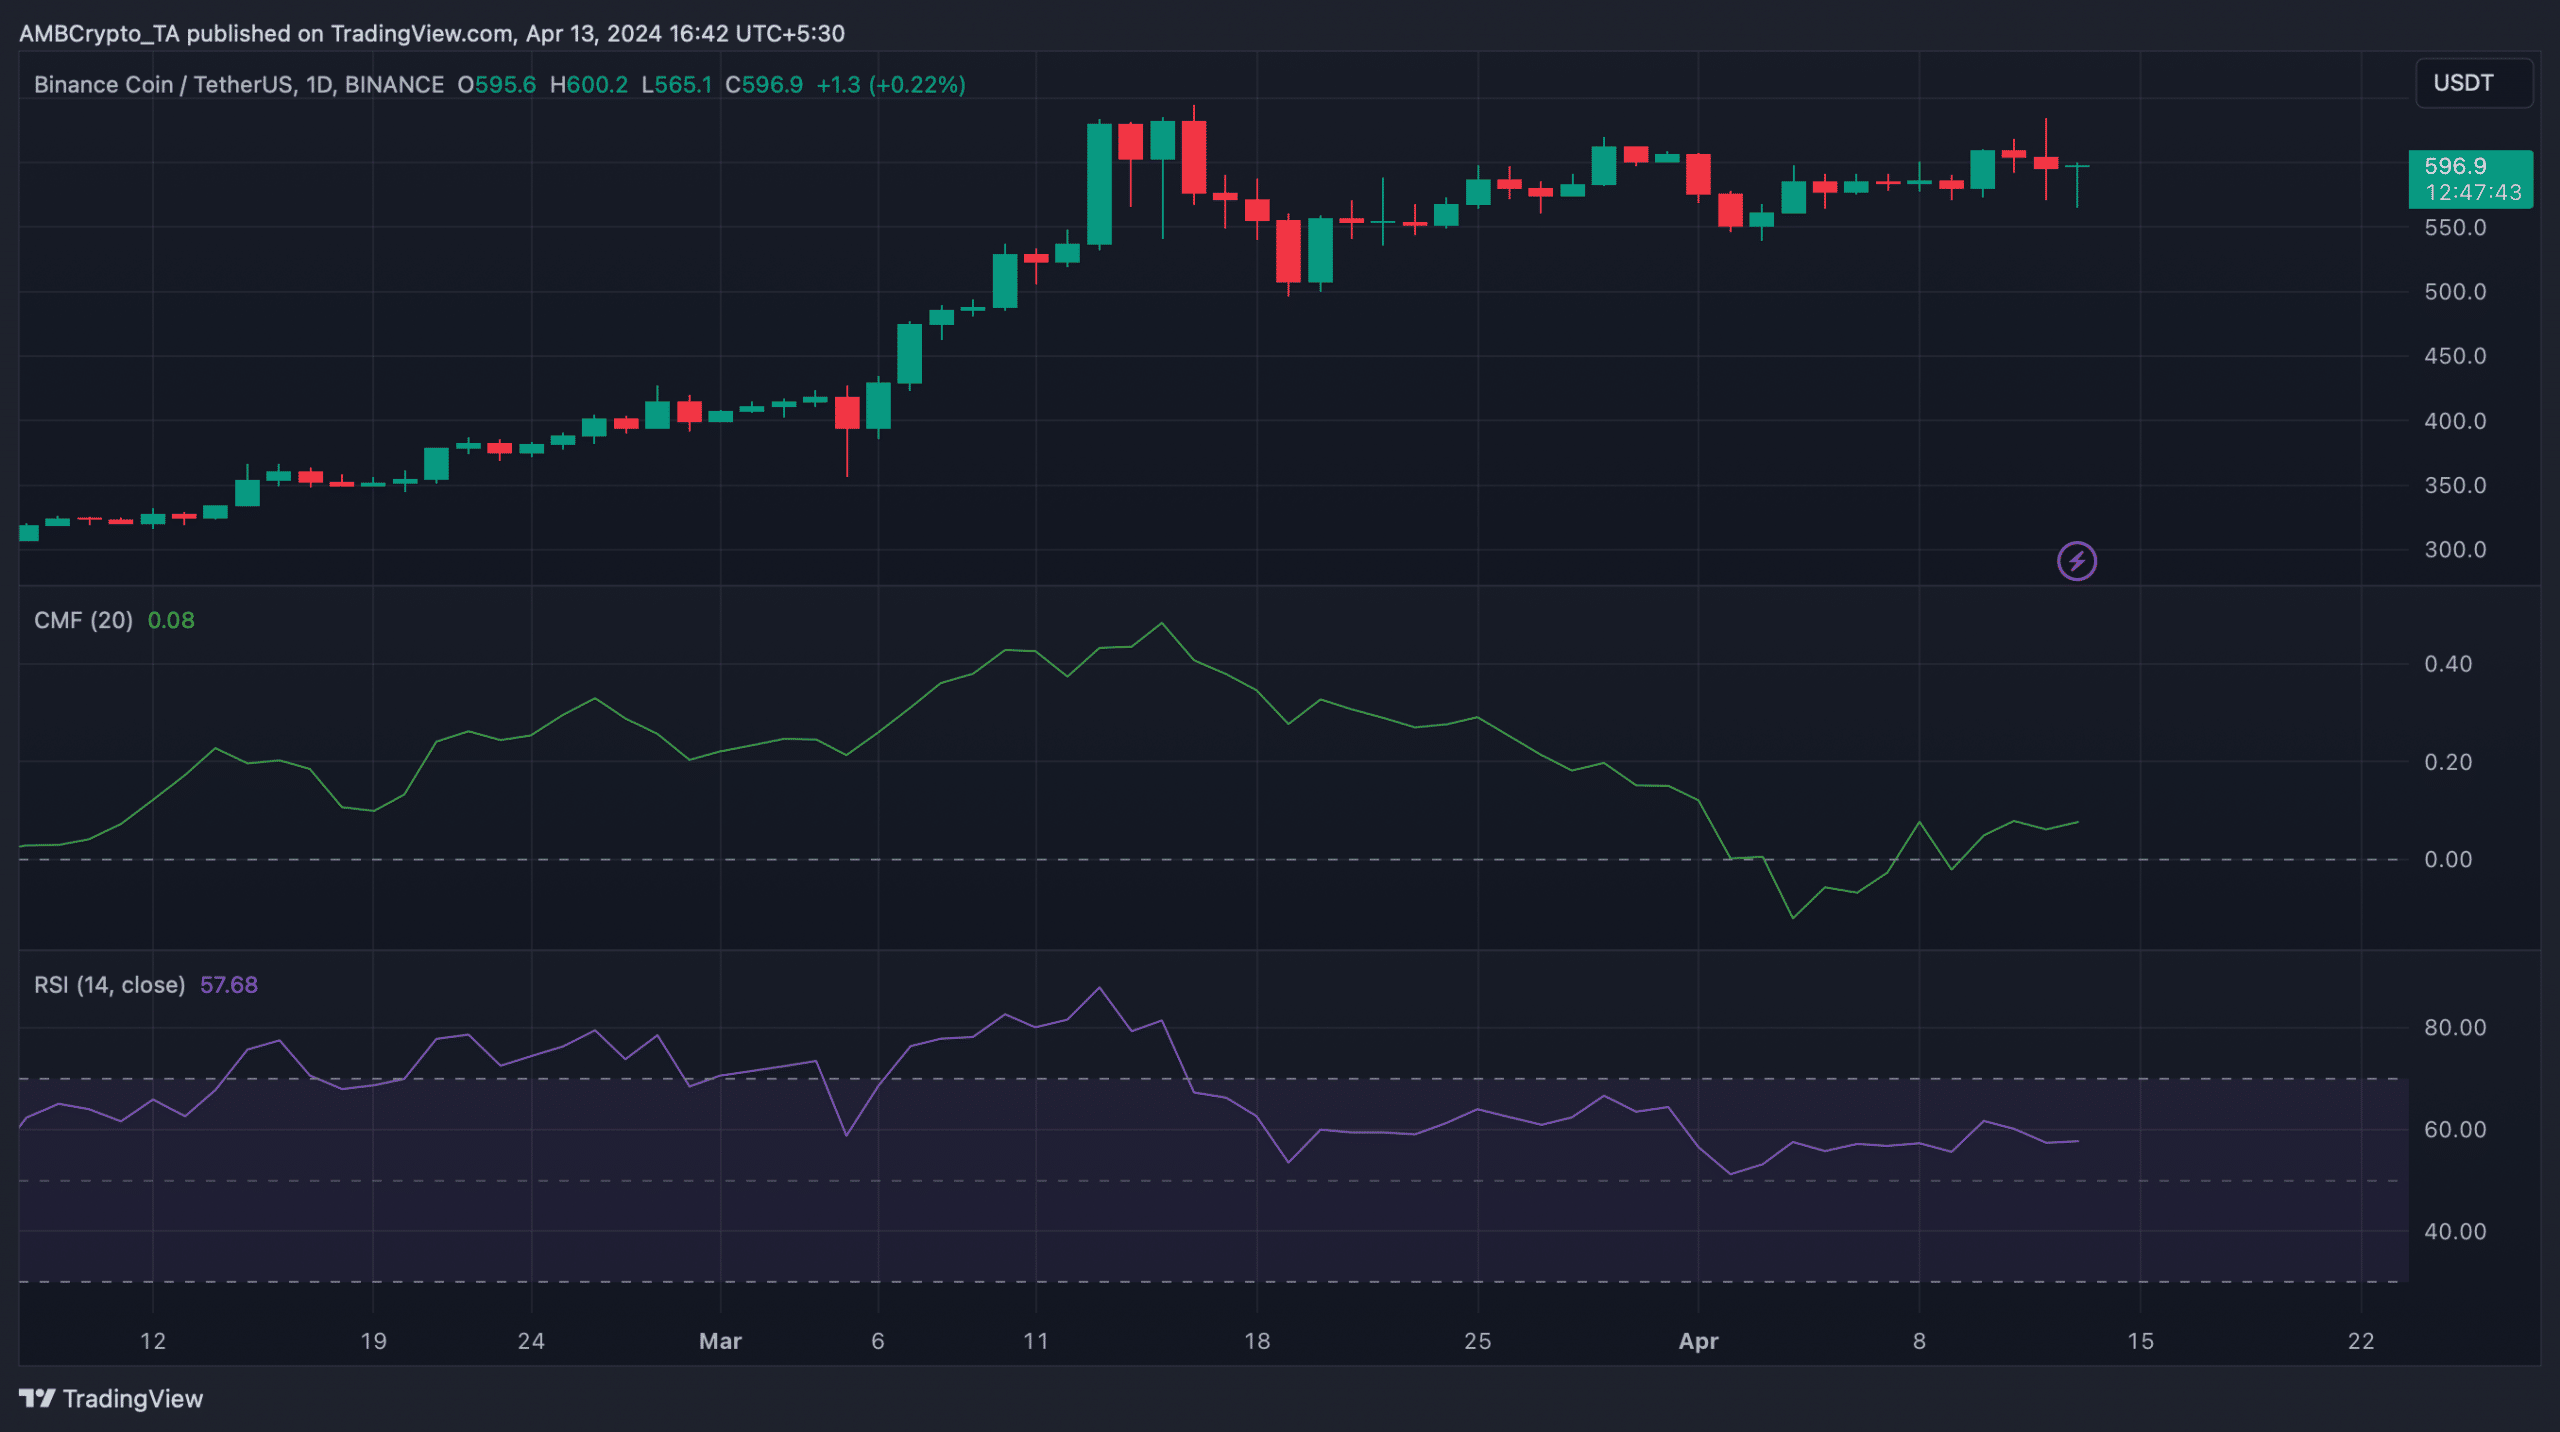
Source: TradingView
Is your portfolio green? Check out the Binance Profit Calculator
Here, it’s worth noting that though the coin’s metrics and indicators seemed bullish, BNB Chain’s network activity has dropped recently.
Our look at Artemis’ data revealed that after spiking on 8 April, both the blockchain’s daily active addresses and daily transactions declined sharply. Ergo, traders should still be wary when dealing with BNB in the short-term.

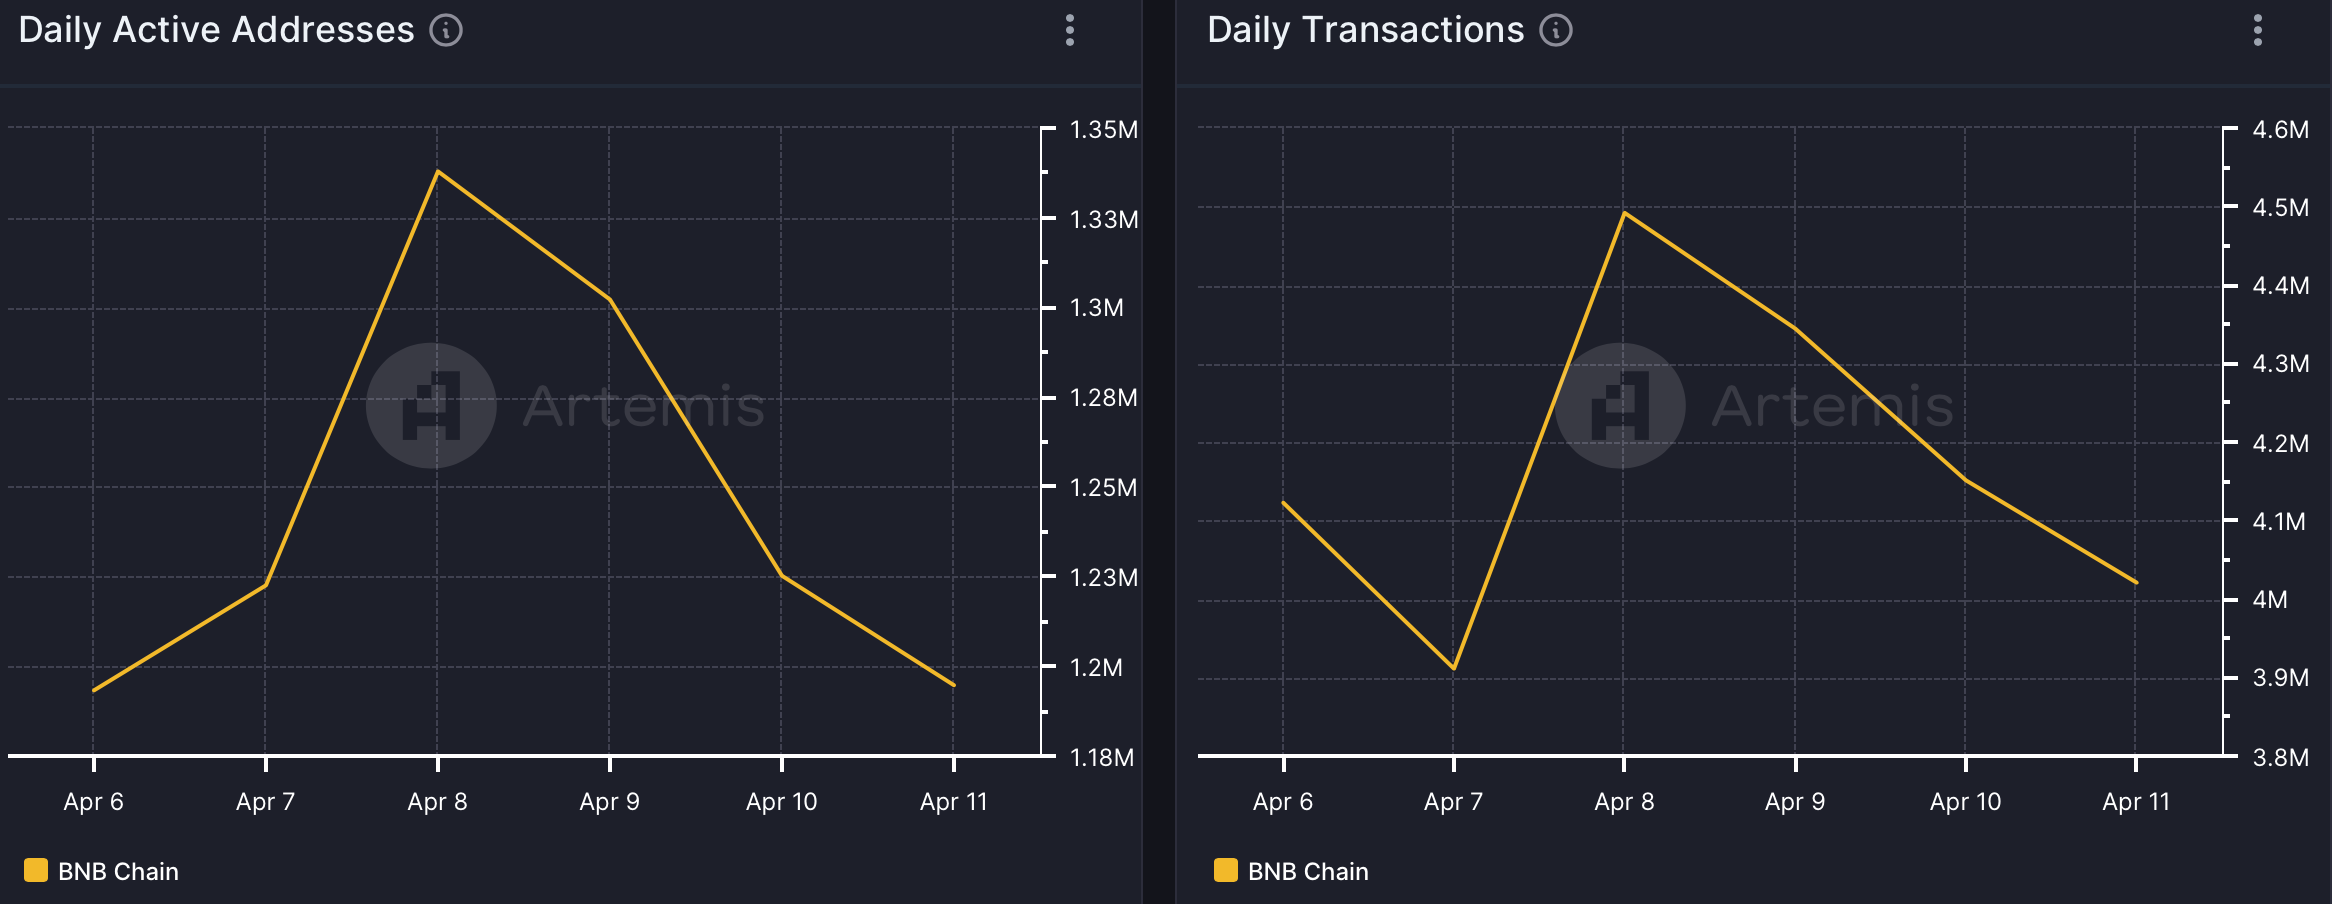
Source: Artemis


Be the first to comment