

Shiba Inu’s (SHIB) ongoing corrective trend prompts questions about its potential price decline and the duration of this movement.
Observers closely monitor key support levels and market dynamics to gauge the extent and duration of the Shiba Inu price decline. Factors such as trading volume, investor sentiment, and external events contribute to this assessment.
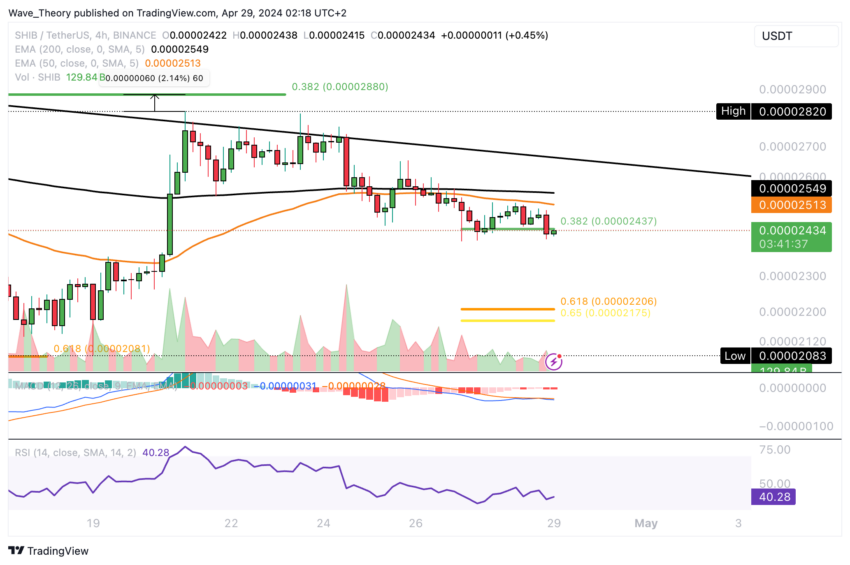
Shiba Inu Tests Key Support: Can Price Hold the .382 Fib Level?
Shiba Inu has recently breached the critical support level of the 50-day EMA, situated at approximately $0.0000248, and is currently seeking substantial support at the .382 Fib level, around $0.0000244. This level may serve as a platform for a bullish rebound, potentially targeting the 50-day EMA resistance.
A successful breakout could propel Shiba Inu towards the .382 Fib resistance at roughly $0.0000288. Despite missing this resistance level by approximately 2% recently, it remains a focal point for potential bullish momentum.
Conversely, a bearish breach of the current support could lead Shiba Inu to the next significant Fib support at approximately $0.000022. Additionally, the Moving Average Convergence Divergence (MACD) histogram has displayed bearish tendencies over recent days, while the MACD lines approach a potential bearish crossover. Meanwhile, the Relative Strength Index (RSI) remains neutral, indicating no bullish or bearish sentiment.
Read More: How To Buy Shiba Inu (SHIB) and Everything You Need To Know
It’s worth noting that Shiba Inu remains within a parallel downward channel, suggesting an ongoing correction phase in the medium term.
Analyzing SHIB’s Bearish Outlook on the 4-Hour Chart
In the 4-hour chart, prevailing indicators lean towards a bearish sentiment. The presence of a death cross on the Exponential Moving Averages (EMAs) solidifies the short-term bearish trend.
Moreover, the MACD lines exhibit a bearish crossover and a downtrend in the MACD histogram.
However, it’s worth noting that the RSI remains neutral, refraining from signaling any specific bearish tendencies. The RSI can evolve into a bullish divergence in the near future.
Is a Deeper Price Correction on the Horizon?
On the bullish side, Shiba Inu encounters significant Fibonacci resistance levels at approximately $0.0000288 and $0.0000355. Conversely, potential Fib support zones lie around $0.000022 and $0.000020. Additionally, the 50-week Exponential Moving Average (EMA) acts as supplementary support, around $0.00001516.
Shiba Inu remains entrenched in a corrective phase, possibly extending further. In the weekly chart, the MACD histogram illustrates a downward trajectory, with impending potential bearish crossover in the MACD lines. Despite these indicators, the RSI maintains a neutral stance, offering no decisive signals.
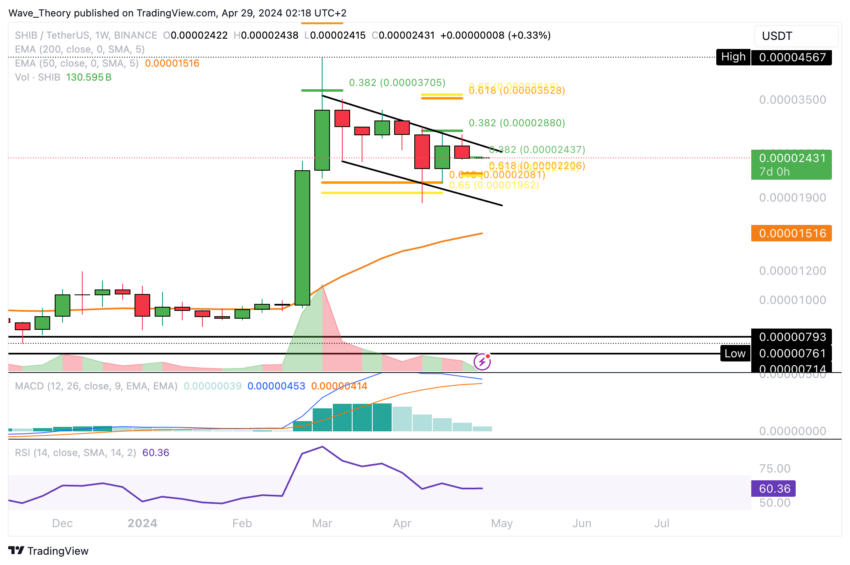
Shiba Inu must surpass the .382 Fib resistance at $0.0000288 to breach the descending channel. Moreover, nullifying the corrective trajectory mandates overcoming the golden ratio at approximately $0.0000355.
Shiba Inu Sees 60% Drop in Price
Since reaching its peak at approximately $0.00004567 last month, the SHIB price has declined about 60%. Despite this significant downturn, the MACD histogram on the monthly chart continues to exhibit a bullish trend, steadily ascending.
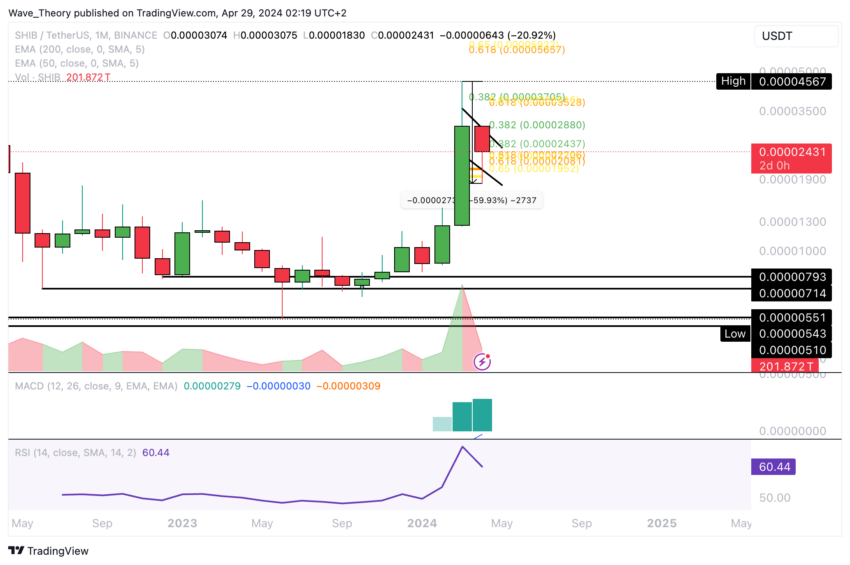
Maintaining a position above the Golden Ratio support, situated around $0.00002, is crucial for sustaining the bullish momentum in the medium term.
SHIB vs. BTC: Shiba Inu Eyes Correction to Next Fib Support
In the 4-hour chart against BTC, there’s a golden crossover in progress, yet this might transition into a death cross shortly. Shiba Inu appears poised to continue its corrective trajectory, potentially aiming toward the 0.382 Fib support level.
Read More: Shiba Inu (SHIB) Price Prediction 2024/2025/2030
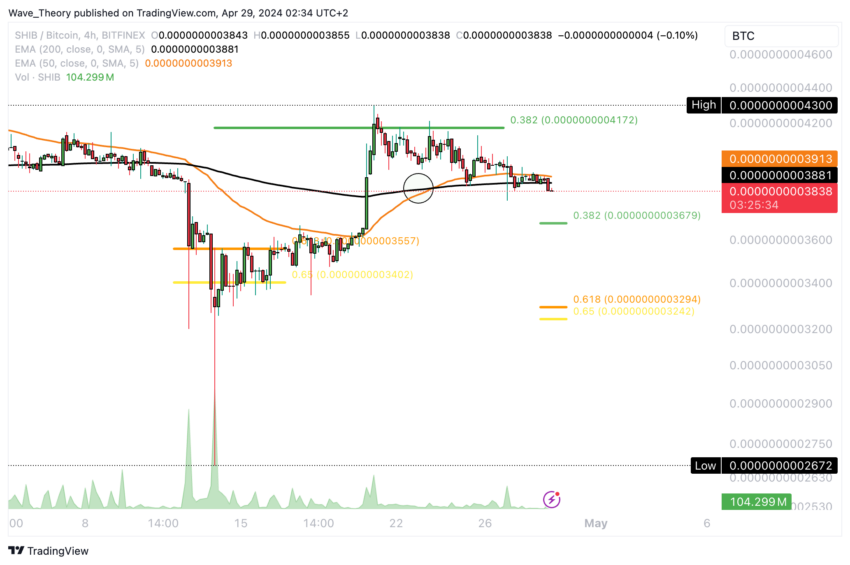
Alternatively, noteworthy golden ratio support lies just beneath this current level.
Disclaimer
In line with the Trust Project guidelines, this price analysis article is for informational purposes only and should not be considered financial or investment advice. BeInCrypto is committed to accurate, unbiased reporting, but market conditions are subject to change without notice. Always conduct your own research and consult with a professional before making any financial decisions. Please note that our Terms and Conditions, Privacy Policy, and Disclaimers have been updated.


Be the first to comment