

- Polygon zkEVM registered growth during the last seven days.
- New partnerships for Polygon, but price action remained negative.
Polygon [MATIC] published Polygon zkEVM’s latest statistics on 31 January. As per the data, zkEVM’s growth over the last week looked promising for the Polygon network.
Source code available? Check
Public testnet? Check
Live prover? CheckZero Knowledge doesn’t mean you don’t have to show your work. Polygon zkEVM is being built transparently.
Here are metrics from last week.
— Polygon ZK (@0xPolygonZK) January 30, 2023
Is your portfolio green? Check the Polygon Profit Calculator
For example, the total number of wallet addresses reached 82,484, with an average block time of 1.1 minutes. Furthermore, the total number of deployed contracts registered over 17% growth, while total blocks increased by 12.6%.
Polygon also partnered with Genso to help improve the latter’s offerings. As a part of this collaboration, Genso will create game worlds that are more detailed and alive than ever before, including landscapes, characters, dynamic weather, and more.
We are beyond thrilled to start openly collaborating with @0xPolygon! We are confident this will help us provide an even more immersive experience for the Genso community. See more in the article below and stay tuned for further updates!https://t.co/9myB9AUqNA#poweredbyPolygon
— Genso Meta (@genso_meta) January 30, 2023
Will these help MATIC?
Despite these developments, MATIC’s price shocked investors by declining by over 6% in the last 24 hours. According to CoinMarketCap, at the time of writing, MATIC was trading at $1.09, with a market capitalization of over $9.4 billion.
Interestingly, despite the recent negative price action, MATIC remained one of the top choices for whales. WhaleStats pointed out that MATIC made it to the list of cryptos that the top 500 Ethereum [ETH] whales were holding.
🐳 The top 500 #ETH whales are hodling
$581,857,477 $SHIB
$148,997,356 $BEST
$93,677,934 $MATIC
$84,718,936 $LOCUS
$83,525,116 $BIT
$68,101,399 $LINK
$64,200,836 $UNI
$61,652,557 $MANAWhale leaderboard 👇https://t.co/tgYTpOm5ws pic.twitter.com/63Jhpl6JDP
— WhaleStats (tracking crypto whales) (@WhaleStats) January 30, 2023
Investors might have more reasons to worry as MATIC’s exchange reserve increased, which was a negative signal as it indicated higher selling pressure. Santiment’s chart revealed that MATIC’s MVRV Ratio registered a downtick, further increasing the chances of a continued downtrend.
MATIC’s one-week price volatility also spiked, making MATIC value vulnerable to an unprecedented change. However, active wallets used to send and receive coins have increased by 25.00% compared to yesterday, which was positive.
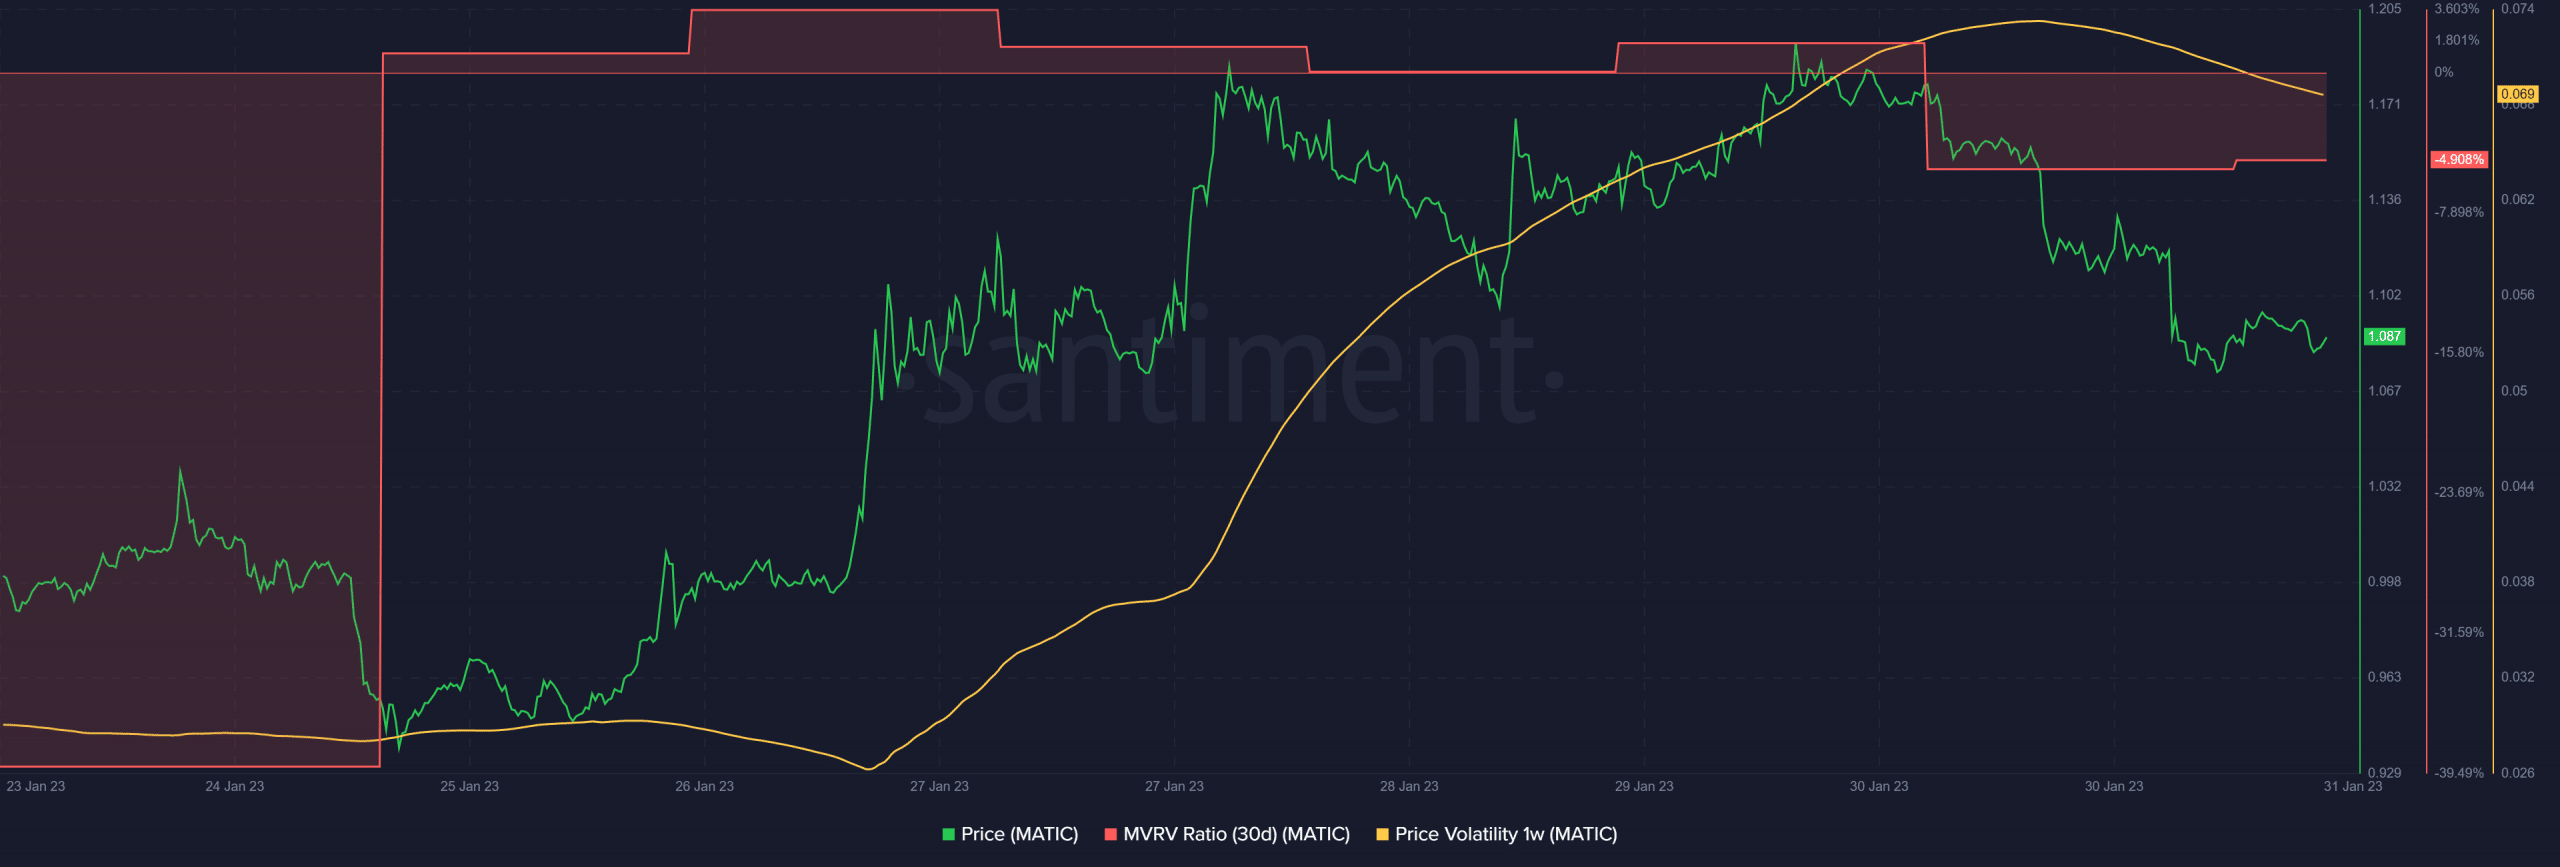
Source: Santiment
Realistic or not, here’s MATIC market cap in BTC’s terms
Bears outperform the bulls
A look at MATIC’s daily chart further established that the bears gained an advantage in the market over the bulls. The MACD displayed the possibility of a bearish crossover soon. MATIC’s Relative Strength Index (RSI) registered a decline, which was a development in the sellers’ favor.
The Money Flow Index (MFI) also declined and was hovering near the neutral mark. As per the Bollinger Bands, MATIC’s price was in a high volatility area, which raised the probability of a price decrease. The Exponential Moving Average (EMA) Ribbon gave investors much-needed hope, as the 20-day EMA was still above the 55-day EMA.
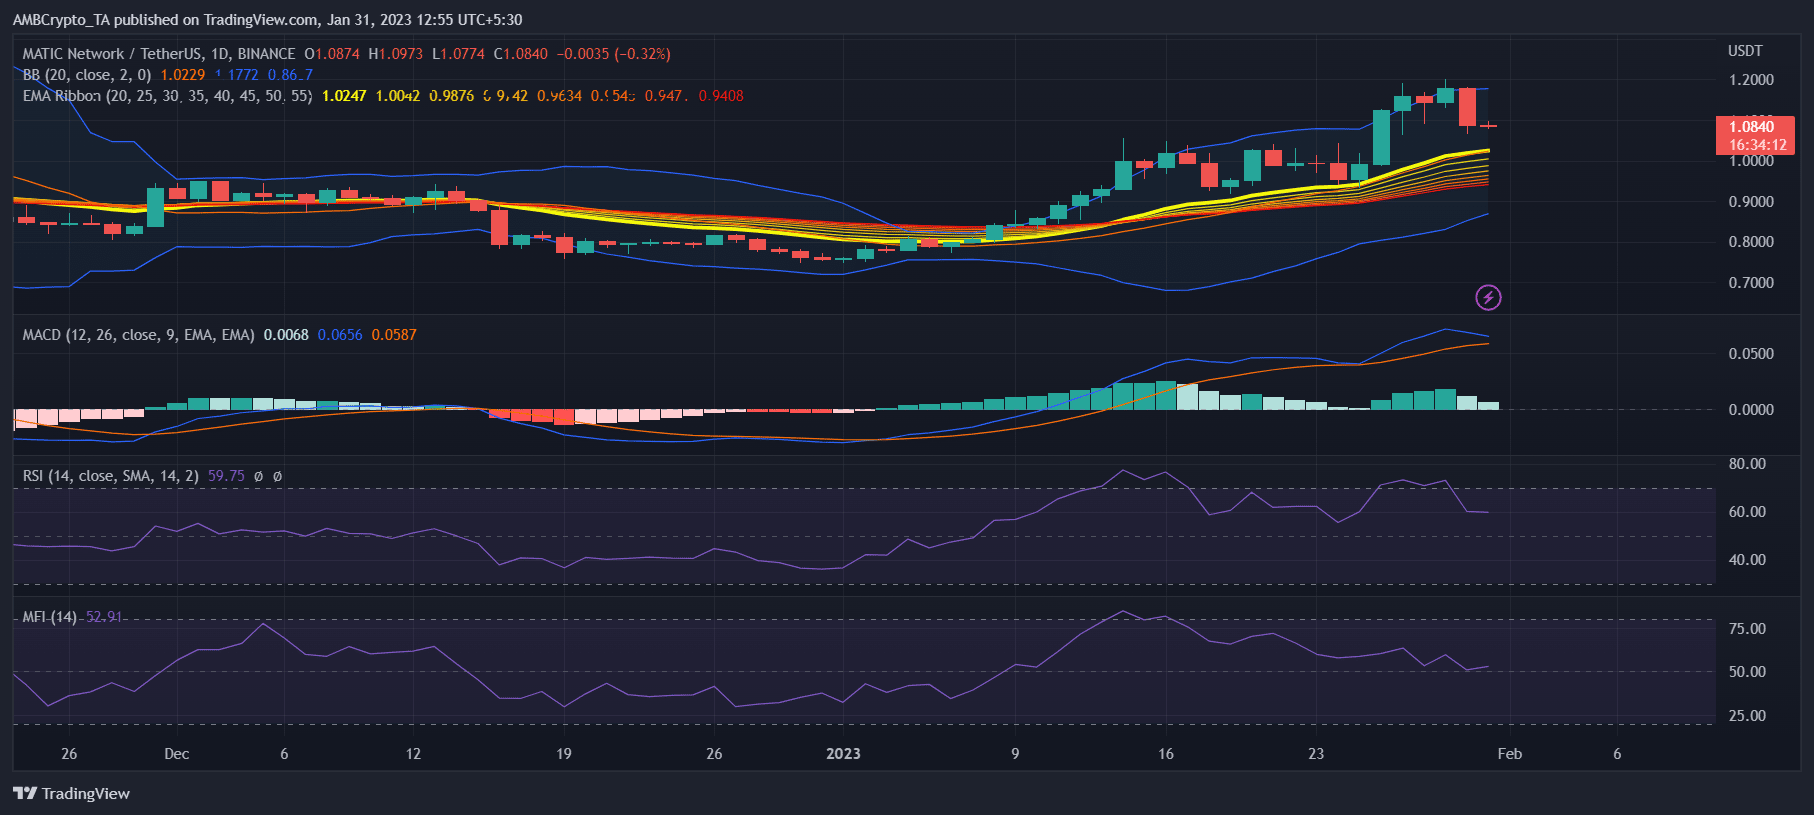
Source: TradingView


Be the first to comment