

- ETH traded at $2999 at press time.
- The cumulative short liquidation of Ethereum rose to over $800 million.
After experiencing a price decline on the 7th of May, Ethereum [ETH] saw more liquidations in long positions. Consequently, more traders opted for short positions.
As a result of this increased shorting activity, the price of Ethereum declined further, falling below the $3,000 price range during the trading session on the 8th of May.
Ethereum traders bet on price decline
AMBCrypto’s analysis of Ethereum’s exchange liquidation map on Coinglass indicated a dominance of short positions at the time of writing.
The cumulative short liquidation leverage for the 24-hour period has risen to over $800 million.
This suggests that traders are increasingly taking short positions, indicating their expectation for the price of ETH to continue declining in the short term.
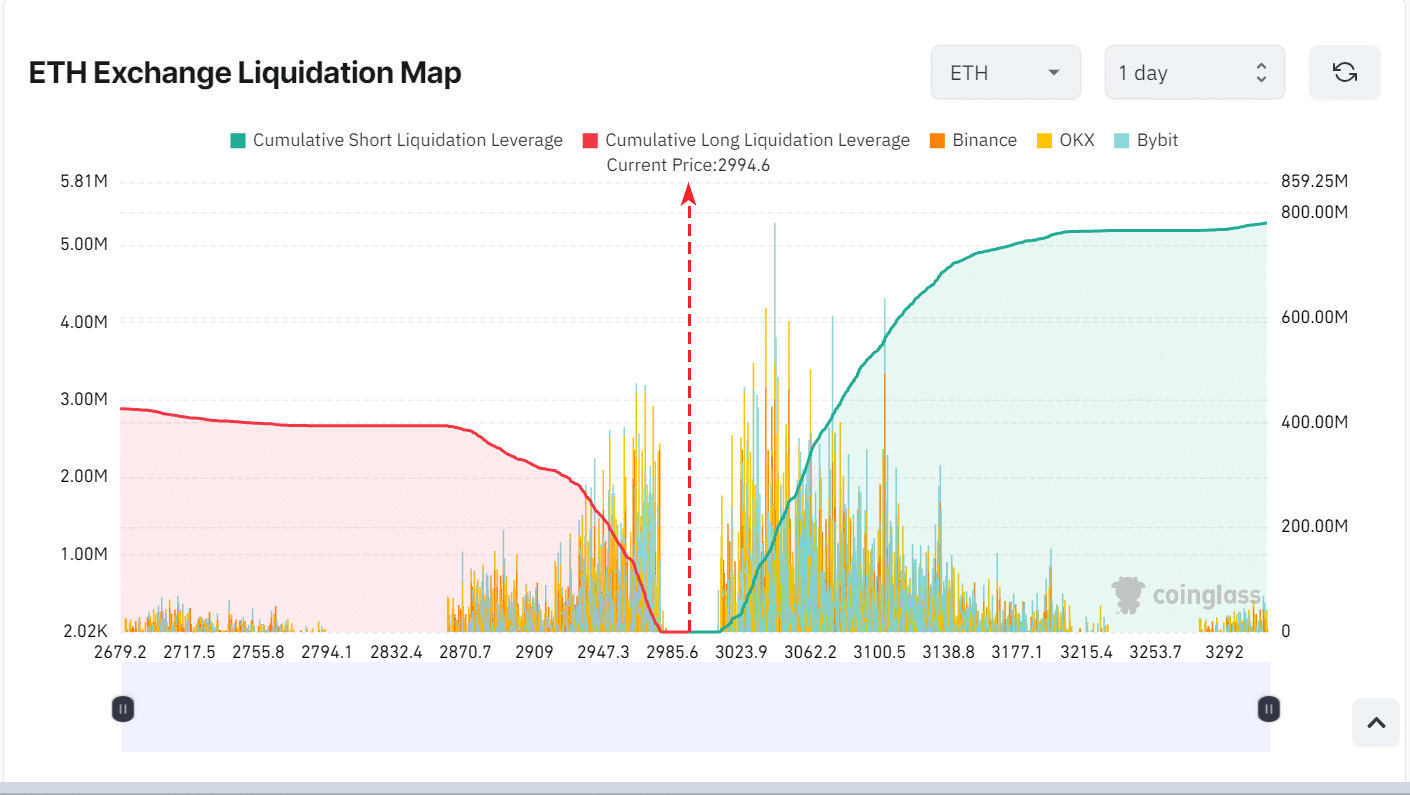
Source: Coinglass
Further examination of the map revealed that the cumulative leveraged position for the last seven days has exceeded $1.7 billion.
Given the prevailing trend in the previous trading session, this current positioning by traders is not unexpected.
Ethereum long positions feeling the heat
Ethereum’s long positions have experienced more liquidations than short positions over the last three days.
AMBCrypto’s look at Coinglass’ liquidation chart revealed that between the 6th and the 7th of May, longs exceeded $78 million.
Conversely, short liquidations, during the same period, amounted to approximately $18.3 million.

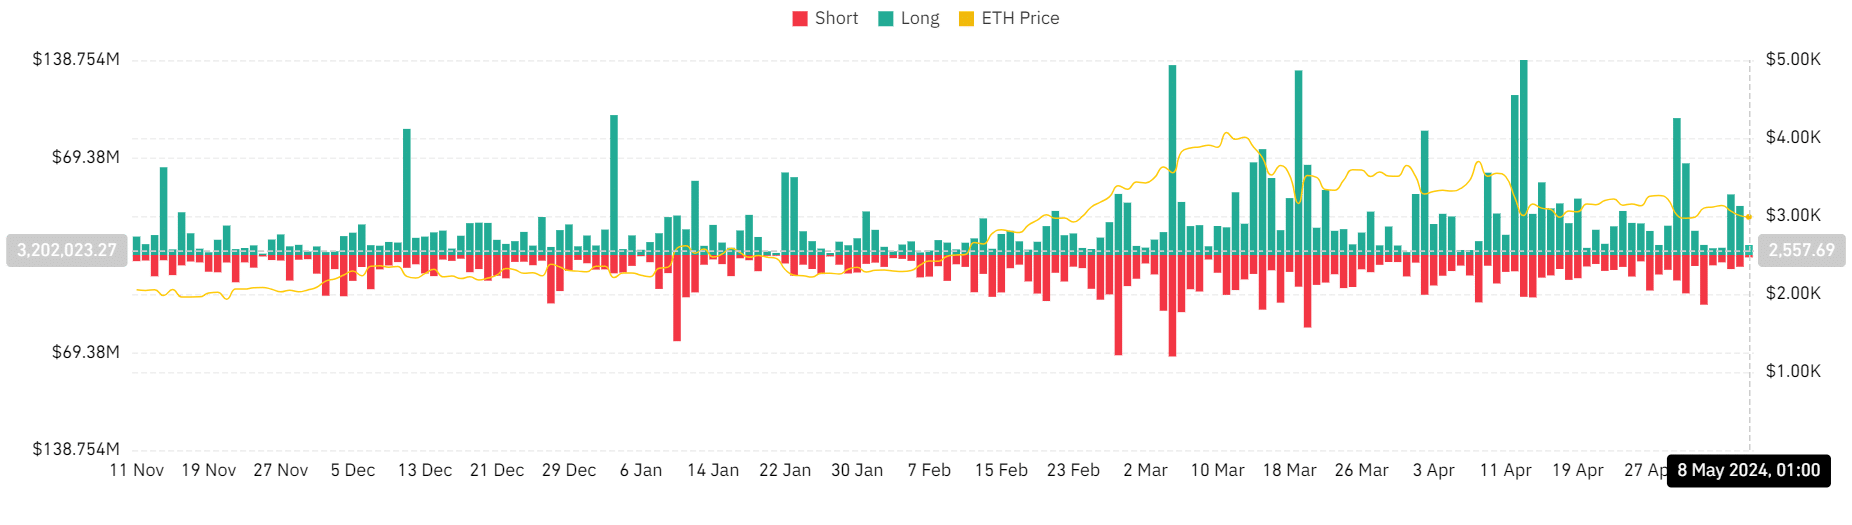
Source: Coinglass
This trend persisted at press time, with long liquidations surpassing $7 million, while short liquidation volume stood at around $1.6 million.
Read Ethereum’s [ETH] Price Prediction 2024-25
ETH goes deeper
AMBCrypto’s look at Ethereum’s daily timeframe price trend revealed a notable three-day decline.
Trading at around $2,999 at the time of writing, with a decrease of less than 1%, the price movement indicated some level of volatility as depicted by the Bollinger Band.
This decline has further entrenched ETH into a bearish trend, with the Relative Strength Index (RSI) standing at 40, signaling a strong bearish sentiment.

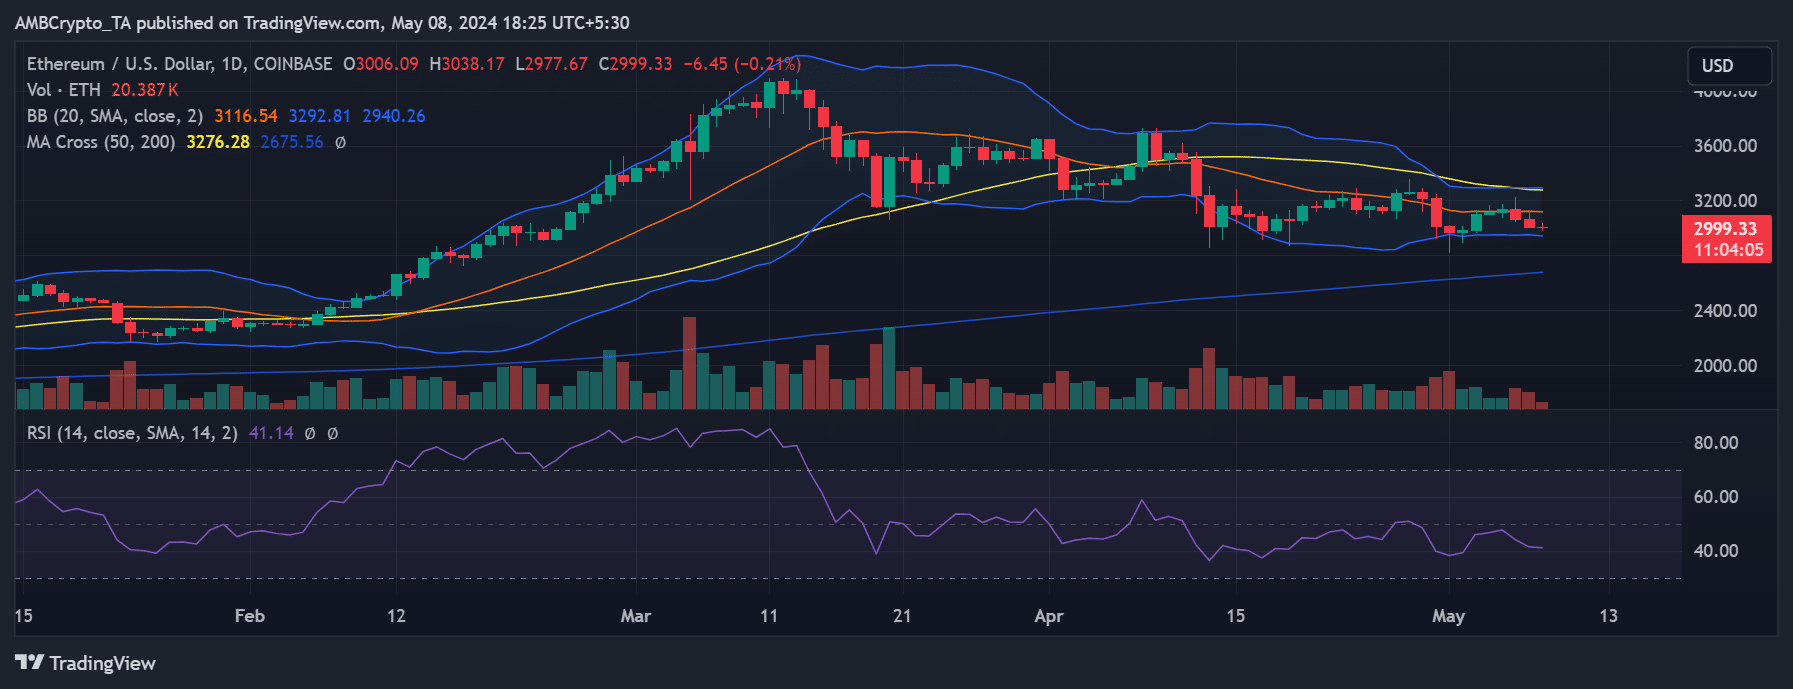
Source: TradingView


Be the first to comment