

Disclaimer: The information presented does not constitute financial, investment, trading, or other types of advice and is solely the writer’s opinion
- The market structure was bearish for BCH on higher timeframes
- A move past $110 toward $115 would likely be a place of interest for bulls and bears
Over the past two days, Bitcoin has been able to defend the $15.8k-$16.2k region. To the north, a significant area of resistance lay at $18.2k. The entire region from $17.8k to $18.5k can see heightened selling pressure, should BTC push that high. Bitcoin Cash also showed some lower timeframe bullish strength.
Read Bitcoin Cash’s [BCH] Price Prediction 2023-2024
However, its outlook on the daily chart continued to have a bearish bias. Until the BCH bulls can drive prices back above $120, this bearish outlook would likely remain. Should traders look to sell a bounce in prices, or can they wait for a surge above $120 to look to buy the coin?
A fair value gap could offer a shorting opportunity
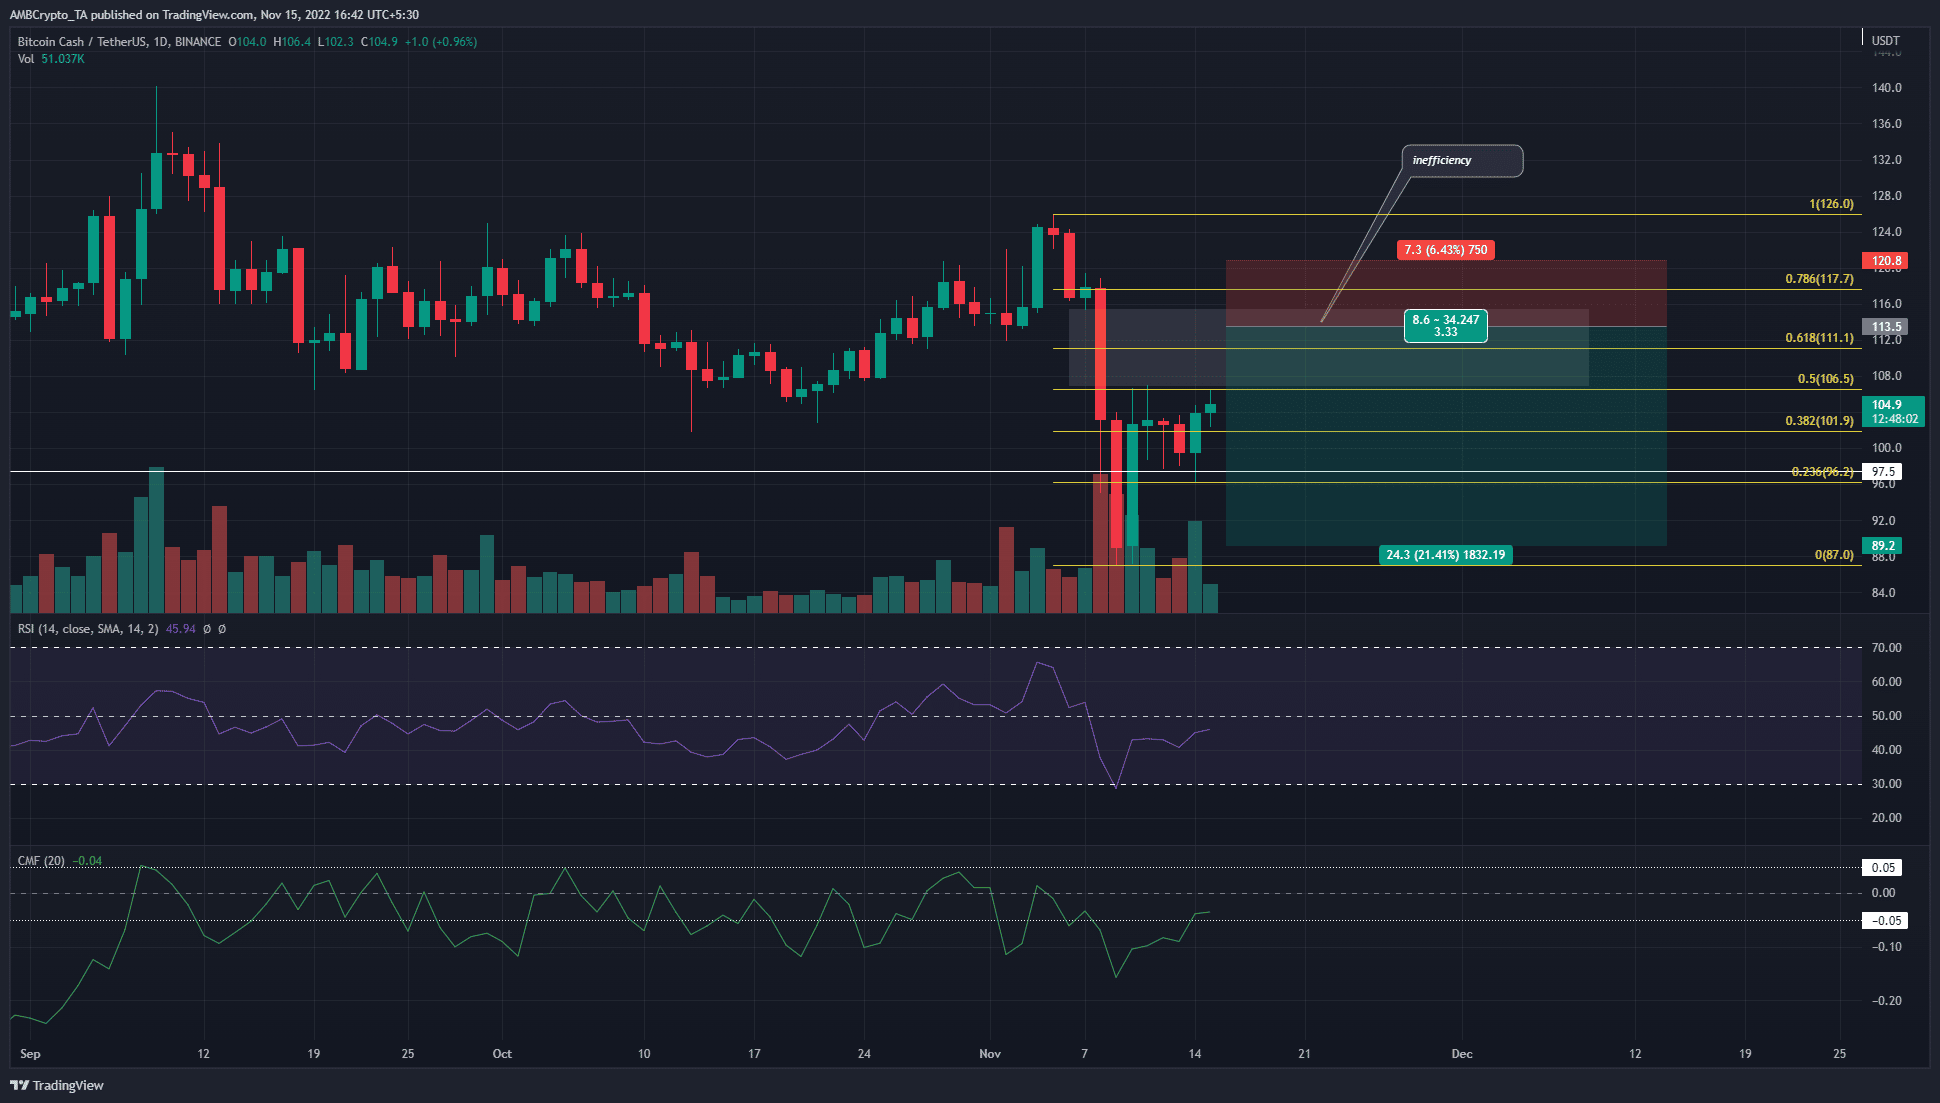
Source: BCH/USDT on TradingView
Based on the swing high and low at $126 and $87 respectively, a set of Fibonacci retracement levels were plotted. It showed the 61.8% and 78.6% retracement levels to lie at $111.1 and $117.7 respectively.
Bitcoin Cash was quick to bounce from the $87 low and quickly surfaced above the $100 mark on 10 November. Since then, its recovery has slowed down. On the daily timeframe, the market structure remained bearish.
On 8 November, the quick pace of the selling meant that inefficiency was seen on the daily chart. This was highlighted by the gray box and has confluence with the Fibonacci golden pocket. Besides that, the $119.4 was a significant level in recent days. A 1-day trading session close above this level would mean that the market structure had flipped to bullish.
The technical indicators also showed some seller strength. The Relative Strength Index (RSI) was below neutral 50, although it signaled more of a neutral momentum with a value of 45. The Chaikin Money Flow (CMF) also climbed to -0.04, which meant that the capital flow out of the market lessened over the past few days.
Hence, traders would likely have a bounce in prices toward the $112-$115 region. A bearish stance in this region would have a clear invalidation above $119.4, while take-profit levels can be set at $100 and $89.
90-day MVRV rakes a hit during the recent plunge
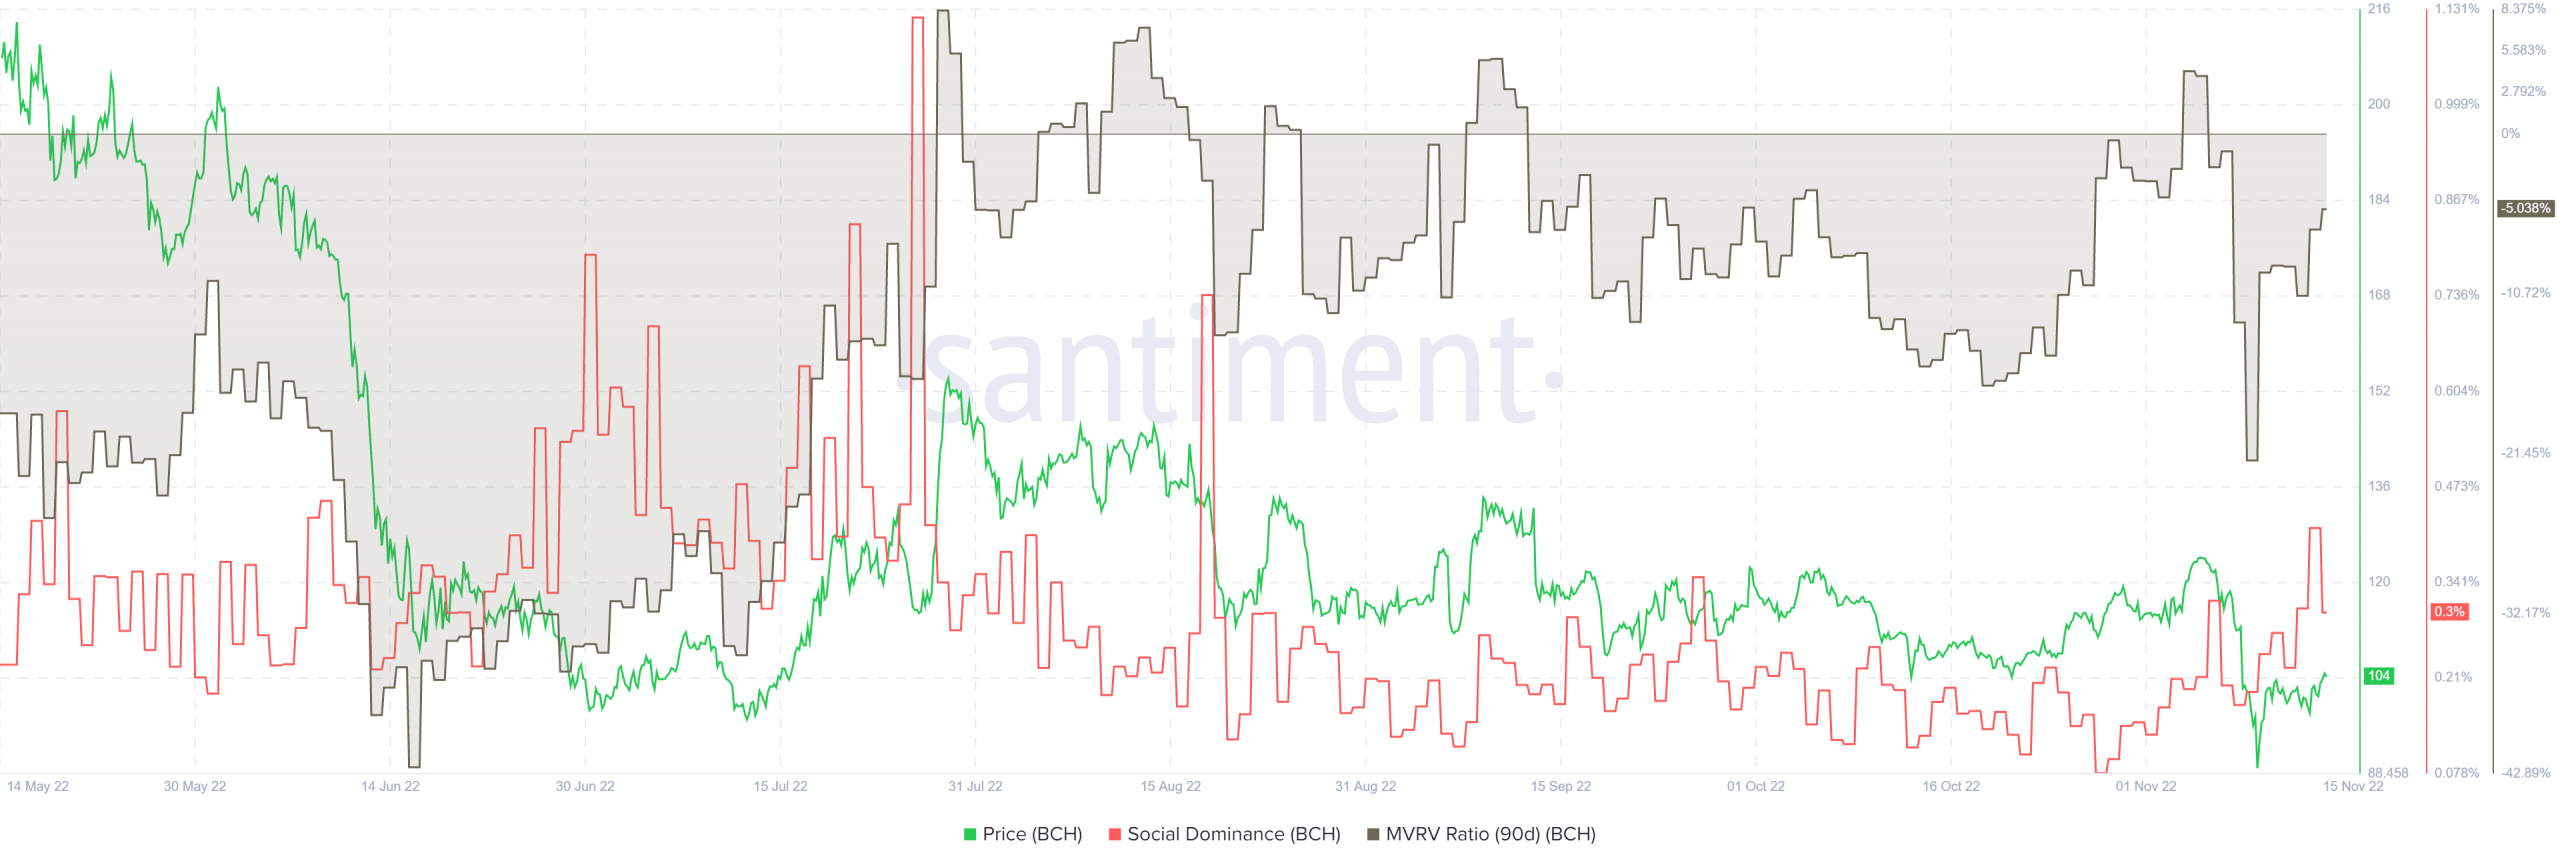
Source: Santiment
In the past few months, almost every time the 90-day Market Value to Realized Value (MVRV) ratio went into positive territory, the price met with significant selling pressure. Most recently this happened on 4 November. Shortly thereafter on 5 November, BCH formed a local top at $126 before a swift decline.
At press time, the MVRV remained in the negative territory. However, a foray toward the 4% or 5% values can be something to watch out for. Meanwhile, Bitcoin Cash’s social dominance for the month of November witnessed a slight increase.


Be the first to comment