
A new year, a new month, another brand new set of Token Ratings. Haven’t read through yet? Here’s what to expect:
-
The team’s verdict on SAND, INDEX, and FXS 📈
-
Which tokens are going to be affected by upcoming insider token unlocks 🔒
-
How we think the Shanghai Upgrade will impact token price 📊
-
And much more.
As always, the first token is available to everyone, but you’ll need to upgrade to Bankless Premium to get access to the rest.
Dear Bankless Nation,
Public blockchains are transparent and open ecosystems, ripe with data around user activity. Dozens of data analytics tools and dashboards have emerged to help savvy builders and investors find the alpha.
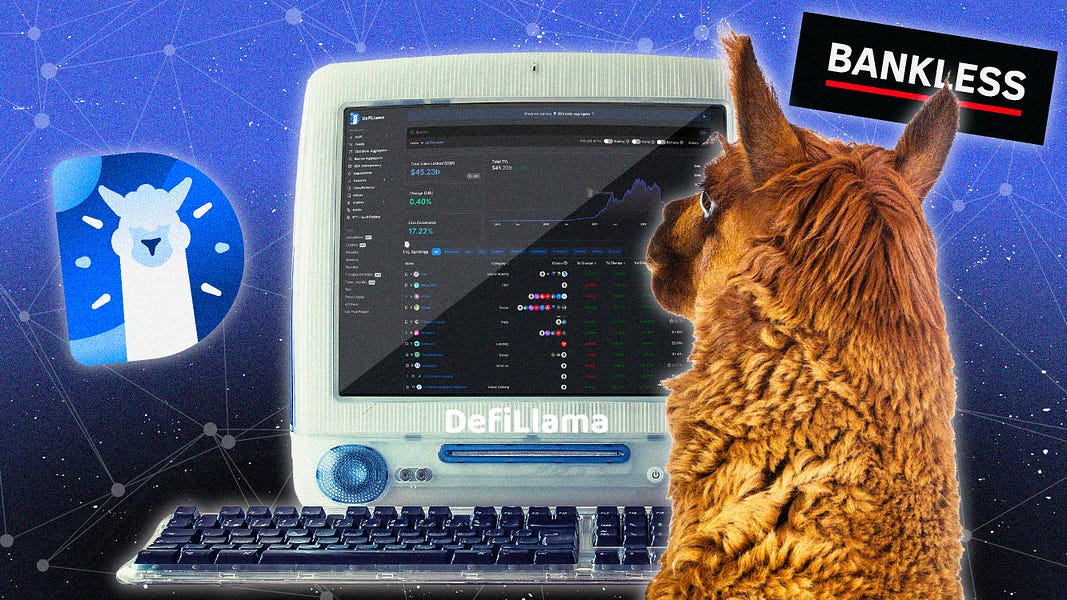
Today, we spotlight one of the most popular: DeFiLlama. It’s free, it’s widely-used by crypto-natives and it keeps getting better. Read on to learn how to get more out of this awesome tool.
– Bankless team
Kraken, the secure, transparent, reliable digital asset exchange, makes it easy to instantly buy 200+ cryptocurrencies with fast, flexible funding options. Your account is covered with industry-leading security and award-winning Client Engagement, available 24/7.
👉 Visit Kraken.com to learn more and start your experience today.
Bankless Writer: William M. Peaster
DeFiLlama is an excellent analytics platform for staying up-to-date on all things DeFi. In this Bankless tactic, we’ll walk through some of DeFiLlama’s best dashboards and tools so you can learn to navigate them for yourself!
-
Goal: Learn the basics of DeFiLlama
-
Skill: Intermediate
-
Effort: Less than one hour
-
ROI: Reviewing some of the best data in DeFi

DeFiLlama is an open and transparent platform for DeFi analytics. It’s renowned for being the largest multichain aggregator of total value locked (TVL) stats and other important DeFi metrics.
In other words, whether you want a bird’s-eye view of the current state of DeFi or to zoom in on activity around a particular app on a particular chain, DeFiLlama has you covered and then some with all of the various free tools it provides.
Specifically, some real examples of ways you can use DeFiLlama’s data dashboards include:
Pretty useful, right? Well now that you’ve got a taste for what’s possible with DeFiLlama, let’s walk through some of the platform’s main resources so you can start getting a sense for how to navigate the site yourself.

The DeFiLlama homepage, a.k.a. the platform’s DeFi Overview dashboard, is great for checking on the present or historical status of the DeFi ecosystem and its chains and apps.
As a visitor you’re immediately presented with DeFi’s current aggregate TVL — i.e. the total value of crypto locked in DeFi projects across the +150 chains DeFiLlama tracks — which was ~$45B USD at the time of this post’s writing.
As you can see in the screenshot above, the graph on the top right side of the homepage visualizes the change in total TVL stats over time. To its left is the Change (24h) metric which shows how much total TVL has changed over the past day, while the Dominance metric shows the largest DeFi project’s current share of the entire DeFi market per current TVL.
In the bottom TVL Rankings section, you can review key info about specific DeFi apps like their Category (e.g. Liquid Staking), their Chains (e.g. which EVM they’re deployed on), their TVL, and their TVL performance stats tracked over 1-day, 7-day, and 1-minute periods.
All that said, if you wanted to zoom in on these sorts of stats but for a specific chain, say Arbitrum, rather than for all of multichain DeFi, then you’d just click on one of the displayed chain filter tags or click on the Others dropdown menu to find a smaller chain. For example, this what the stats hub for just Arbitrum looks like:

Similarly, if you wanted to review the TVL stats of a particular app, e.g. GMX, just click on its name in the TVL Rankings section, after which you’ll be taken to that project’s bespoke stats and overview page, like so:


This is DeFiLlama’s homebase for the most important DeFi yield farming stats. Notably, the main Pools page presently tracks nearly 8,000 unique yield farming opportunities across +230 protocols and +50 chains.
By default, the Pools opps are sorted from largest TVL to smallest, but DeFiLlama provides an array of different filters — from APY to Tokens Involved — if you want to get more granular in your search for ongoing yield farms.
Additionally, the Yields dashboard offers other themed pages including:
-
💰 Borrow — a stats hub for current borrow and supply APYs across DeFi
-
➿ Leveraged Lending — a stats hub for leveraged lending APYs in DeFi
-
🏊 Stablecoin Pools — a stats hub for stablecoin-centered yield farming opps

The Volume dashboard is where you can get up-to-date volume stats for DeFi as a whole or for specific projects. The search and filter features are the same as the previous dashboard, so you can use these to select for the areas of DeFi that you want to see data for. There’s also a bespoke Chains page here that you can use to readily visualize and compare chain-level info.


This data hub is where you can quickly compare how much fee payments chains and DeFi apps have accrued over 7-day and 30-day periods. The dashboard also shows 24-hour revenue stats, i.e. the cut of the past day’s fee payments that have been returned to token holders and/or a project’s treasury. Want to see if a protocol is profitable? This is a great place to start!

As you can guess from the name, the Stables dashboard is where you can go to check the pulse of DeFi’s stablecoin sector at any given time. The main overview page shows and visualizes the total aggregate market cap of all DeFi’s stablecoins, which is currently ~$137B.
Down in the rankings sections you can track activity flows across different stablecoins or stablecoins tied to a particular chain. There’s also a dedicated Chains page if you want to zoom in on comparing chain-level data for stablecoins.

ETH liquid-staking derivatives (LSDs) are all the rage lately ahead of Ethereum’s upcoming Shanghai network upgrade, which will allow ETH stakers to withdraw their staked ETH.
That said, DeFiLlama recently launched an LSD dashboard so DeFi users can readily track LSD activity and the growth of the leading derivatives compared to one another.
Specifically, this dashboard displays different LSDs, like Lido Staked ETH (stETH), and these derivatives’ current market shares, TVLs, staked ETH numbers, and ETH peg stats.
DeFiLlama does much more than just publish analytics dashboards, as the platform’s builders have also released a variety of tools aimed at making the lives of DeFi users easier. Some of these resources include:
-
🔌 LlamaNodes — a source of public and premium web3 RPCs
-
🗒️ Directory — a database for going directly to DeFi websites to avoid Google scam results
-
📣 Roundup — a daily bulletin of DeFi news and crypto happenings
-
🔥 Trending Contracts — an ongoing directory of smart contracts with notable activity uptrends (Ethereum + Polygon presently supported)
-
💧 Token Liquidity — a search tool for quickly finding the most liquid trading avenues for token pairs on the most popular DeFi chains

Lastly, one of DeFiLlama’s newest resources is its DEX Meta-Aggregator, a.k.a. LlamaSwap. While still in beta, this service aggregates other popular DEX aggregators like 1inch, CowSwap, and Matcha in order to offer traders the best, most-efficient routes for their DeFi trading needs. If you’re one to aim for the lowest-cost trades possible, consider checking out this DEX of DEXes.

In my opinion, DeFiLlama is the best analytics platform around for DeFi users.
Its free dashboards, of which I only covered a selection of above, offer a range of valuable info and insights about the DeFi ecosystem, and they do so at both the macro (all of DeFi) and micro (specific chains/apps) levels. Knowledge is the great edge in crypto, and DeFiLlama can help you get deeply knowledgeable around all of your DeFi decisions.
Spotting trends, staying up-to-date, engaging deeper with the ecosystem … these are the ways that DeFiLlama can help you shine!
William M. Peaster is a professional writer and creator of Metaversal—a new Bankless newsletter focused on the emergence of NFTs in the cryptoeconomy. He’s also recently been contributing content to Bankless, JPG, and beyond!
Subscribe to Bankless. $22 per mo. Includes archive access, Inner Circle & Badge.
👉 Kraken has been on the forefront of the blockchain revolution since 2011 ✨
Not financial or tax advice. This newsletter is strictly educational and is not investment advice or a solicitation to buy or sell any assets or to make any financial decisions. This newsletter is not tax advice. Talk to your accountant. Do your own research.
Disclosure. From time-to-time I may add links in this newsletter to products I use. I may receive commission if you make a purchase through one of these links. Additionally, the Bankless writers hold crypto assets. See our investment disclosures here.


Be the first to comment