

Key Insights:
-
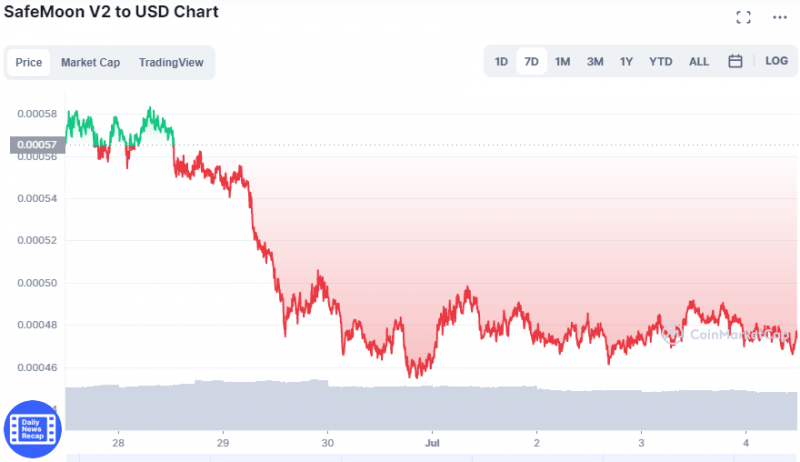
SFM has fallen 30% since its previous rally in June.
-
Its downtrend coincides with a corresponding drop in Bitcoin’s price.
-
Technical analysis shows that short-term sentiment on SFM is bearish.
SafeMoon is a decentralized finance (DeFi) token created in March 2021 by former U.S. Department of Defence analyst John Karony. It relies on four functions during each trade: reflection, liquidity provider acquisition, a burn mechanism and contribution to the ecosystem growth fund.
The token’s price has fallen 30% since its previous rally in June and SFM could potentially be facing more sell-offs. Notably, its downtrend coincides with a corresponding drop in Bitcoin’s (BTC) price which is now trading below $20,000.
Price Action
SFM started its journey in December 2021 at $0.0017. After a bull run commenced that same month, the token climbed from $0.00165 on December 30 to $0.0029 the next day.
However, its price plummeted to $0.00158 shortly thereafter on January 22, 2021, wiping out over half of its value in the space of 18 days.
SFM is currently trading at $0.000468 and ranks 3001st in the list of cryptocurrencies worldwide by market capitalization at $263 million. Its price is down over 3% in the last 24 hours.

The SafeMoon crypto is on the verge of testing $0.0004 support again and has been trading sideways since its price saw a rejection beneath a descending parallel channel. The coin is down an astonishing 93% from its all-time high of $0.007232 set on January 4, 2022.
More recently, SFM showed signs of recovery after consolidating between the $0.000584 and $0.000414 price levels since June 19. However, a run for the 70.5% retracement level at $0.000876 would have cemented the possibility of an upswing.
Technical Indicators
SFM has formed a bearish pennant pattern and is trading above the key $0.00045 support level, with the likelihood that bearish momentum will continue throughout this month. This means that the next key support level to watch will be at $0.00040.
Technical analysis shows that short-term sentiment on SFM is bearish, with 9 indicators displaying bullish signals compared to 13 bearish signals at the time of writing.
The daily simple and exponential moving averages (EMA) are giving sell signals, while the relative strength index (RSI) stands at 39.
An RSI reading of 30 or below indicates an oversold or undervalued condition, while a reading above 70 would suggest the asset is becoming overvalued or overbought.
In terms of a SafeMoon crypto price prediction, SFM could see its price falling to $0.000000000421 by August 2022, dropping to $0.000000001 in January 2024 and hitting $0.000000000482 by January 2025.
This article was originally posted on FX Empire


Be the first to comment