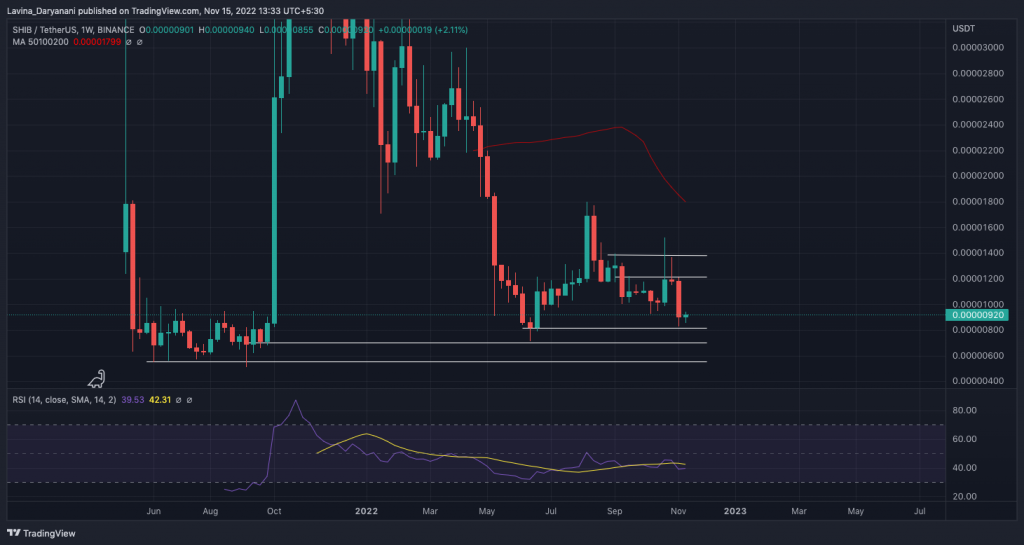
Over the last couple of days, Shiba Inu has been trying to initiate a recovery. When compared to yesterday’s daily low of $0.00000855, SHIB was already up 7% in the past 24 hours at press time on Tuesday.
Of late, Shiba Inu’s Relative Strength Index reading has been hovering below 40, indicating insufficient buying pressure. However, at press time, data from ITB revealed that market participants have slowly started adding SHIB tokens to their stashes. Over the past hour alone, the buyer-seller trader trade difference reflected a positive value of nearly 75 billion tokens. The same on the 6-hour and 12-hour frames stood even higher at 200 billion and ∼500 billion.

In fact, even on the on-chain front, things seemed to be aligned for Shiba Inu. Despite the past rough week, the number of new addresses joining the network has risen by 275%, while the number of active addresses noted an upward inclination of over 81.88%.
Simply put, an address is considered to be active when it becomes a direct participant in a successful transaction. And new addresses, as such, gauge the number of fresh entrants into the ecosystem. Conventionally, the higher the numbers, the better, for they hint towards refining participation by traders/investors. Effectively, the ongoing uptrend seems to be healthy and encouraging.

Shiba Inu’s macro perspective
At the moment, Shiba Inu has room to glide upto roughly $0.000014 over the next few weeks. It will, however, have to overcome a brief hurdle midway, as illustrated below. Post attaining the said level, there are odds of another sell-off spree materializing.
More so, because the price band between $0.000014 to $0.000020 would act like a stiff resistance. The said range is the largest cluster volume-wise where 97.74k addresses have together bought a total of 448.74 trillion SHIB tokens.

If the FTX-drama prolongs, or any other unforeseen event takes place in the crypto space, or if Bitcoin re-initiates its correction, Shiba Inu will tag along. In a downside event, the largest meme-coin can stoop all the way down to its 2021 H2 lows to collect liquidity. However, it might also end up finding solace at a couple of levels before that itself, as indicated in the chart.


Be the first to comment