

- DOT’s RSI and stochastic were oversold, which was bullish
- Metrics also supported a price hike while a few of the indicators were against it
Polkadot’s [DOT] recent price action was not up to the mark as it registered negative weekly growth. As per CoinMarketCap, DOT was down by nearly 3% over the last seven days. Furthermore, it was trading at $4.49 with a market capitalization of over $5.1 billion.
However, CryptoQuant’s data revealed that things might take a U-turn soon!
Read Polkadot’s [DOT] Price Prediction 2023-24
A celebration for investors
As per CryptoQuant, Polkadot’s Relative Strength Index (RSI) and stochastic were both in oversold positions. This was a major bullish indicator that suggested a price surge in the coming days.
Interestingly, Polkadot Insider, a popular Twitter handle that posts updates related to the Polkadot ecosystem, revealed its weekly stats. This further established the popularity of Polkadot in the crypto community.
Furthermore, as per the tweet, Polkadot’s social engagement exceeded 43 million, reflecting its popularity. Not only that, but Polkadot’s Galaxy score also looked positive.
Thanks to @LunarCrush, we aggregated some important social metrics about $DOT 👇
Let’s take a look at our graphic below. It will show you how the community feels about @Polkadot in the last 7D 🔥#Polkadot $DOT #DOT pic.twitter.com/iVQFkoaUrV
— Polkadot Insider (@PolkadotInsider) December 25, 2022
Furthermore, Polkadot’s metrics also showed signs of recovery, as most metrics suggested that the token’s price would rise in the coming days. For instance, DOT’s Bionance funding rate registered an increase, reflecting its demand in the derivatives market.
DOT’s development activity also went up, which could be taken a positive signal. DOT also managed to remain popular as its social volume spiked last week.
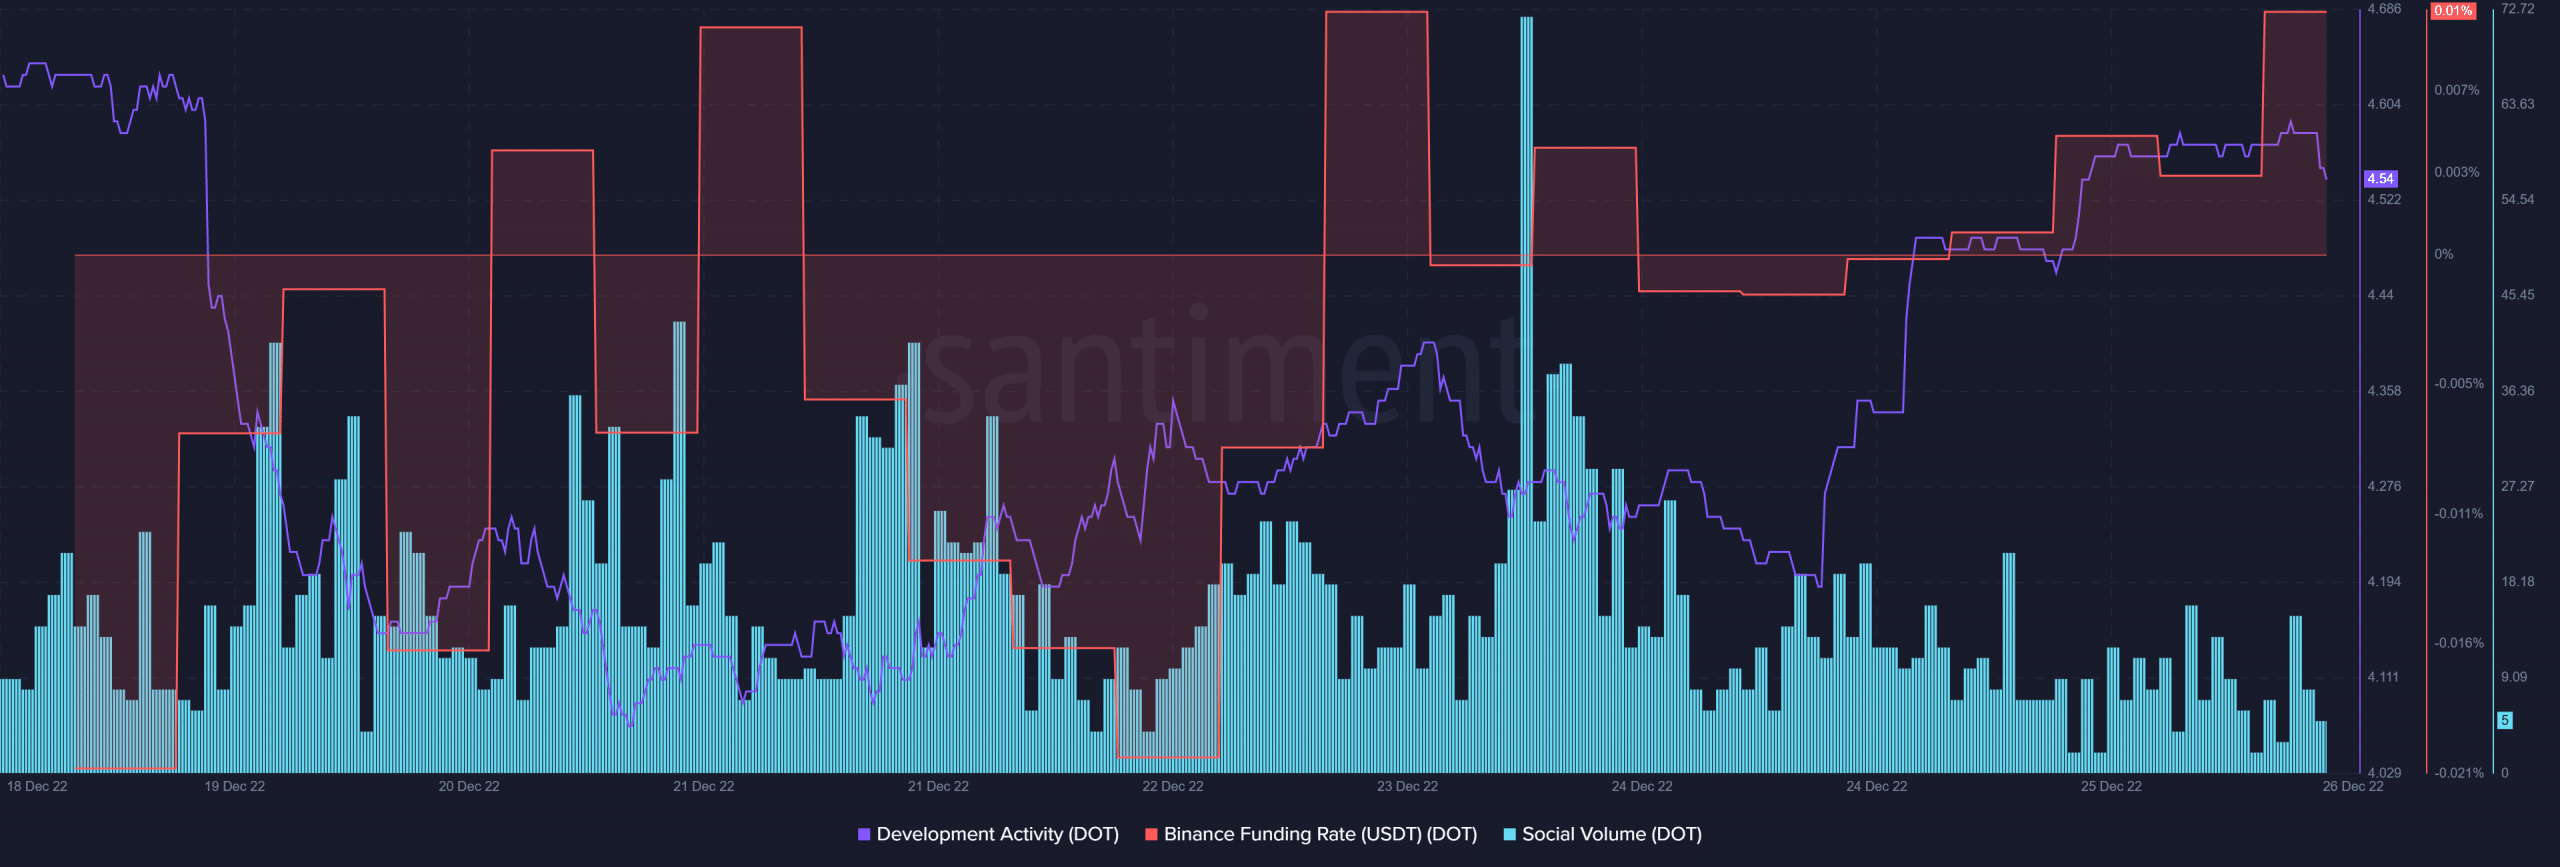
Source: Santiment
Are your DOT holdings flashing green? Check the Profit Calculator
The ‘but’ investors should watch out for…
While the metrics looked bullish, DOT’s market indicators revealed an ambiguous picture. For instance, the Exponential Moving Average (EMA) Ribbon pointed out that the bears were leading the market.
Moreover, the Chaikin Money Flow (CMF) also registered a slight downtick, which was concerning. Nonetheless, the Moving Average Convergence Divergence (MACD) suggested that the bulls might soon take over as it displayed the possibility of a bullish crossover.
DOT’s Money Flow Index (MFI) also registered an uptick, which was in the buyers’ favor.
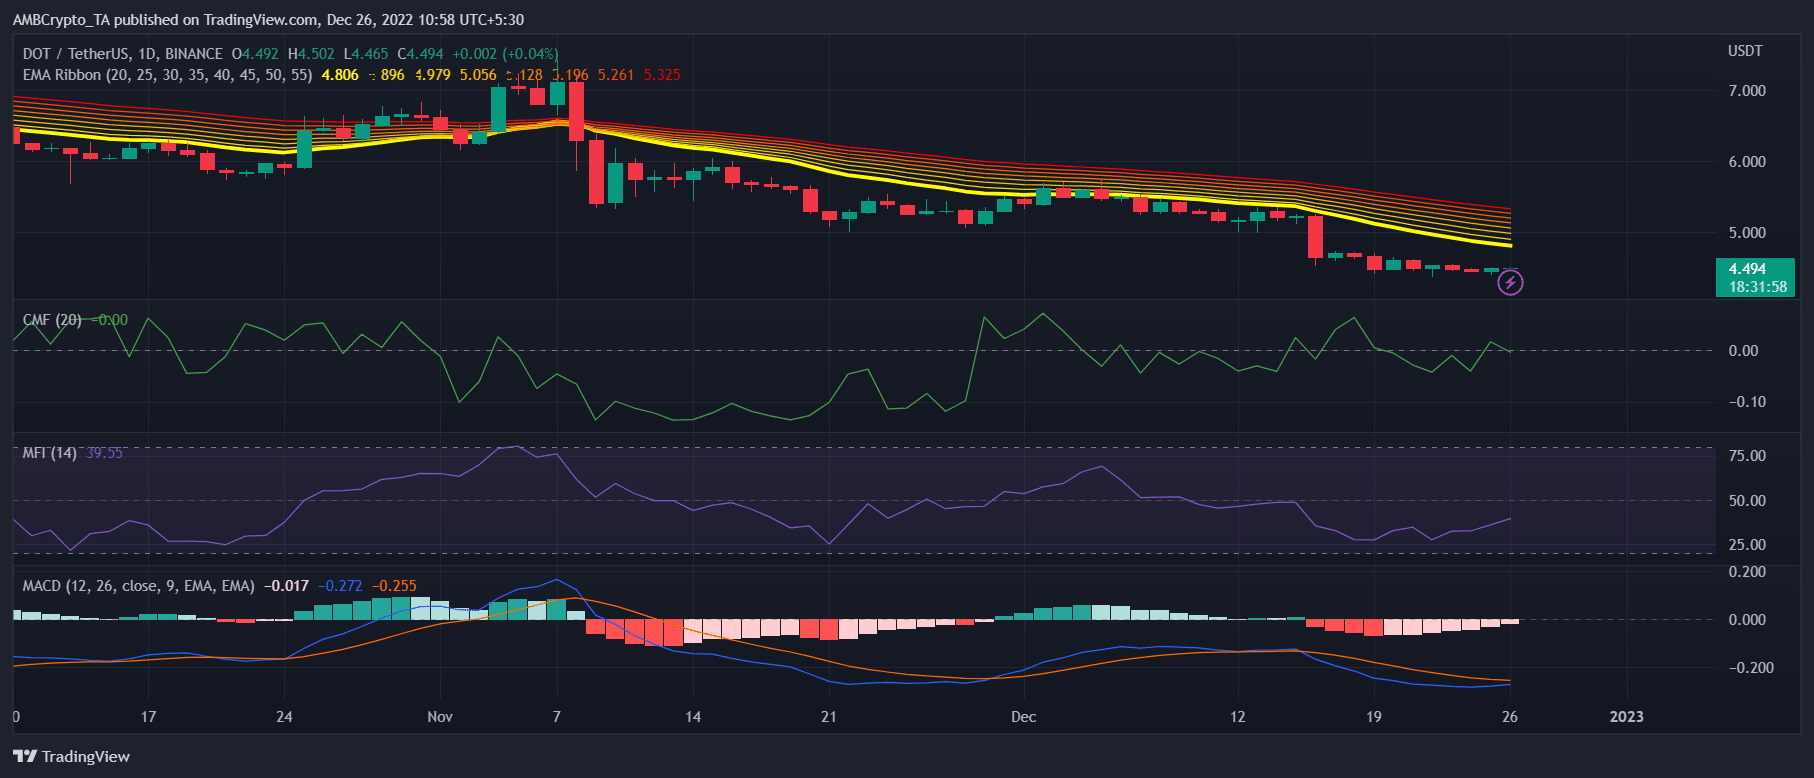
Source: TradingView


Be the first to comment