

- SafeMoon price is targeting a rally back to at least $0.001500000, the high of April.
- SAFEMOON breaks its downtrend and turns higher.
- The token price action is torn between scam accusations and technicals with relatively big bullish potential.
UPDATE: Safemoon price has seen some steep up-and-down moves in the last 24 hours. SAFEMOON bulls were able to rally past the $0.0008000 resistance lat on Wednesday and managed to generate a daily candlestick close above $0.0009000. Despite this frenzy of bullish price action, Thursday has brought a severe retracement, and after touching the psychological $0.0010000 mark, Safemoon price has come back to trading around the resistance-now-turned short-term support at $0.0008000. Question marks keep surrounding this altcoin, which has seen a notable rally in the past two weeks after losing almost all its value from January to April. The transition from SAFEMOON V1 to V2 was not well-received by the markets and some Safemoon investors, including several whales, have reportedly sold their tokens and moved to rival projects. Safemoon short-term technical analysis is bullish and indicates a target at $0.0015000, April’s high.
Safemoon daily price chart (source: TradingView)
PREVIOUS UPDATE: Safemoon price keeps coming back from the dead, closing in on a key horizontal resistance at $0.0008000, where it set daily candlestick highs both on April 20 and on the frenzy May 12 price action. SAFEMOON current price action chart only goes back to January 2022 as the Safemoon contracts were updated on a 1000:1 consolidation in the transition from V1 to V2. The goal of this consolidation was to reduce the number of tokens without affecting the value, but the move to V2 was not well received by the market as SAFEMOON went from trading at a $0.002188 high on January 22, the second day after the transition, to touching a low of $0.0002870 on May 11, losing 88% of its value in the process. This led to many questioning the validity of the project, including accusations of this cryptocurrency being “a scam” like the one made by the popular Youtuber “Coffezilla.”
Since then, Safemoon price has started a bullish reversal which has already seen a massive relative gain of 168% from the May 11 bottom. The question here is if SAFEMOON technical analysis – explained below – can be useful to determine future price action, or if this cryptocurrency only moves based on sudden speculative moves.
SafeMoon (SAFEMOON) price is back amongst the living after being in the dark for so long. Since the launch of the second version around December last year, its price action has been in a straight downward line, which since last week is coming to an end. With the break above the red descending trend line and the break above the 9-Day Simple Moving Average, a clear signal has been delivered to the markets and will work like a magnet to attract more investors and see price action appreciating towards $0.001500000, or 130% of gains.
SAFEMOON bulls are on their way to booking 130% gains during a hot summer
SafeMoon price is on the cusp of booking its most robust rally ever after two major bearish elements have been taken out. Add to that the fact that more tail risks are getting deflated in global markets and therefore weighing less on price action and it looks as if SafeMoon price will get unchained and develop more free room to balloon higher as the dollar itself fades for the third day in a row.
SAFEMOON price is set to rally substantially as more investors find a way into SafeMoon price action, and the upside potential is immense. It is worth keeping an eye on $0.0008000000, with its 50% Fibonacci level as a critical line in the sand for whether SafeMoon price can rally up towards that previously mentioned $0.00150000000. A second level where some profit-taking will occur is at $0.000989810 or the 38.2% Fibonacci level, forming a double barrier with the psychological $0.0010000000.
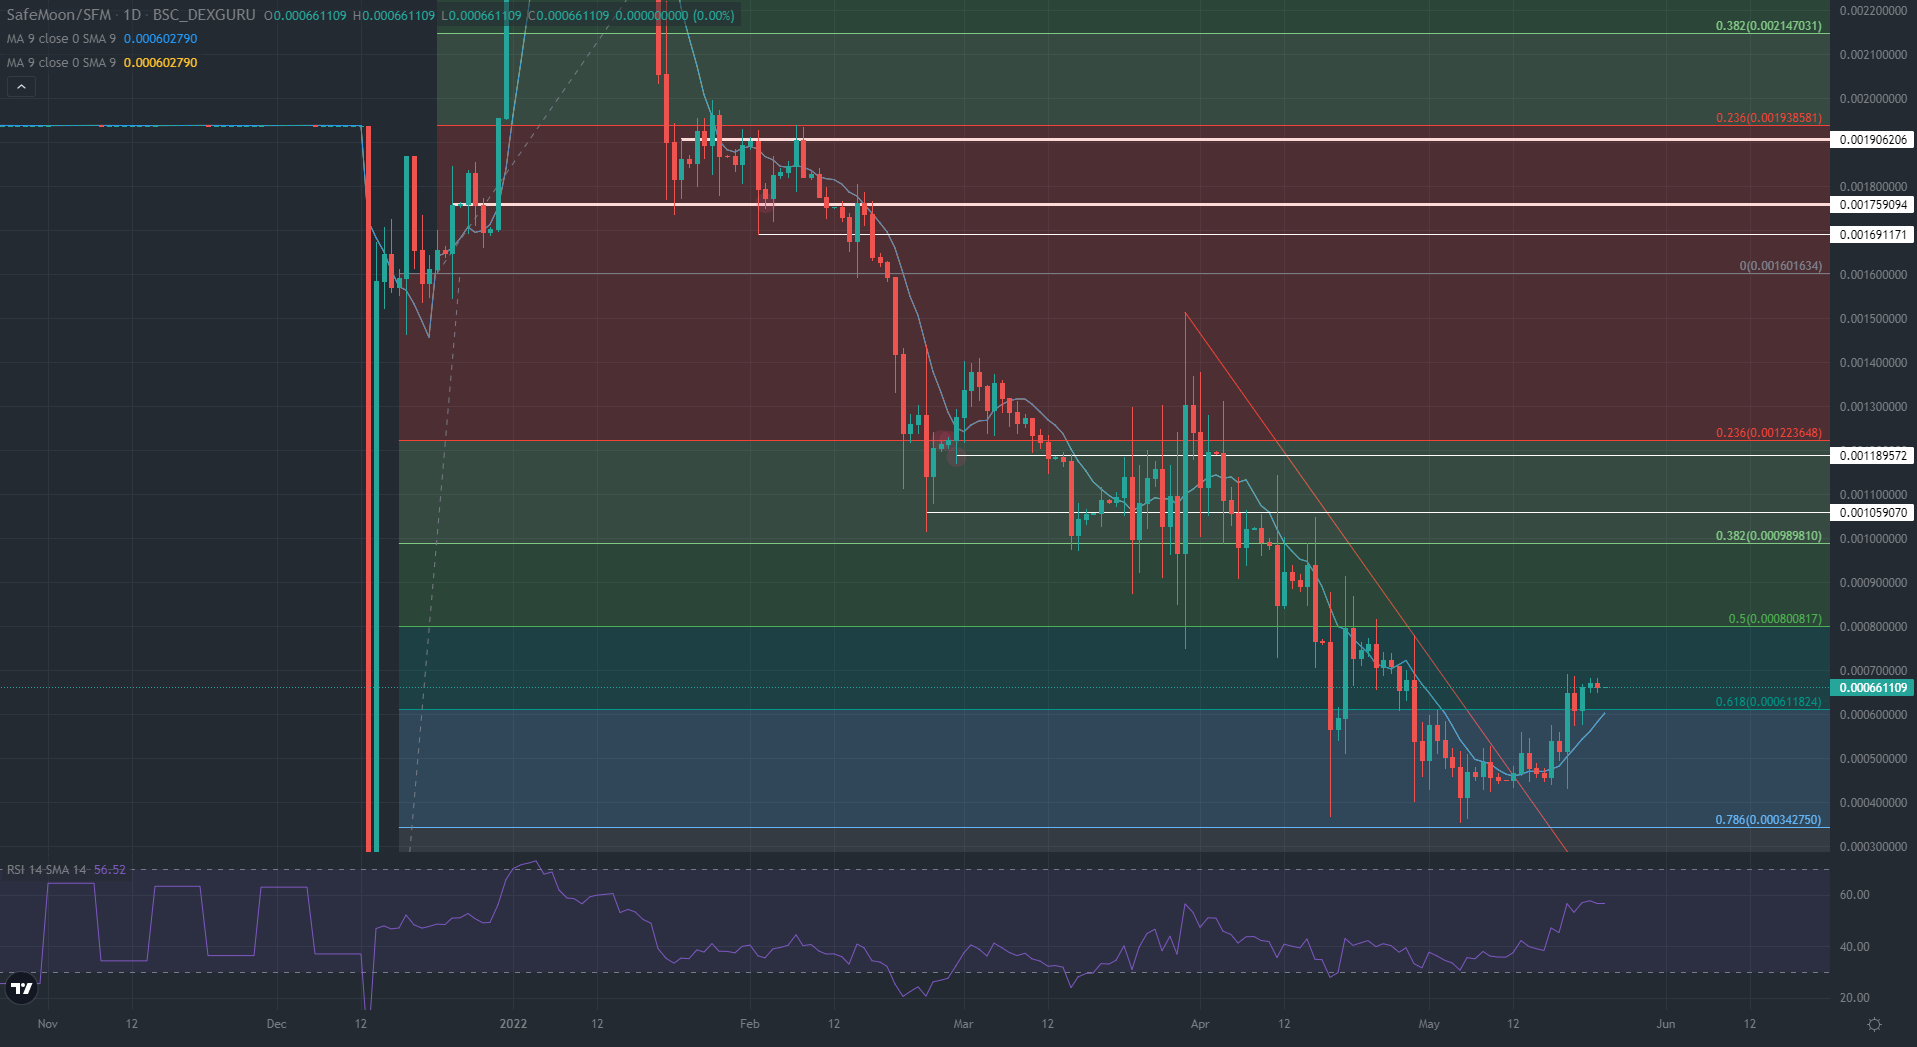
SAFEMOON/USD daily chart
With still a lot of room to go, the 50% Fibonacci level might be a bit too far off, seeing the Relative Strength Index (RSI) has overheated a bit and is already too close to being overbought to sustain a continuous rally towards $0.001500000. An overshoot could see bulls taking their profit and not returning, triggering SafeMoon price to drop below $0.000611824, the 55-day SMA. This way, a downward path might get reopened again towards $0.000342750, as interest wanes.


Be the first to comment