

The Fantom (FTM) price is in the process of breaking out from a bullish pattern. Doing so would go a long way in confirming a bullish trend reversal.
2022 was not kind to decentralized finance (DeFi) protocols, showing a decrease of 77.6% in total value locked (TVL) since Dec. 2021. Moreover, numerous DeFi protocols have collapsed, mainly due to poor risk management, insufficient revenue, and overuse of leverage.
Despite the bear market, the Fantom price shows strong reversal signs and could soon break out from its bullish pattern.
Fantom Price Reclaims Long-Term Level
The Fantom price has decreased since its all-time high of $3.48 in Oct. 2021. The drop continued until a minimum price of $0.16 in Nov. 2022. The low was made below the $0.20 horizontal support area, which has been in place since 2021.
While breakdowns from such long-term structures usually lead to significant plunges, the Fantom price reclaimed the area shortly afterward. As a result, it only deviated (green circle) below $20 before reclaiming the area.
Moreover, the price also broke out from a descending resistance line that had been in place since the aforementioned all-time high. It validated it and the $20 area as support later in Dec. (green icon).
There are other bullish signs beside the price action. The weekly RSI has generated a considerable amount of bullish divergence (green line). Additionally, it completed a bullish failure swing pattern by moving above the high between the divergences.
Therefore, the most likely Fantom price analysis is an increase toward the next long-term resistance at an average price of $0.41. However, a weekly close below the $0.20 area would invalidate this bullish hypothesis.
Fantom Short-Term Price Prediction: Wedge Breakout Can Confirm Reversal
The technical analysis from the daily time frame is also bullish. As a result, it indicates that the Fantom short-term price prediction is bullish.
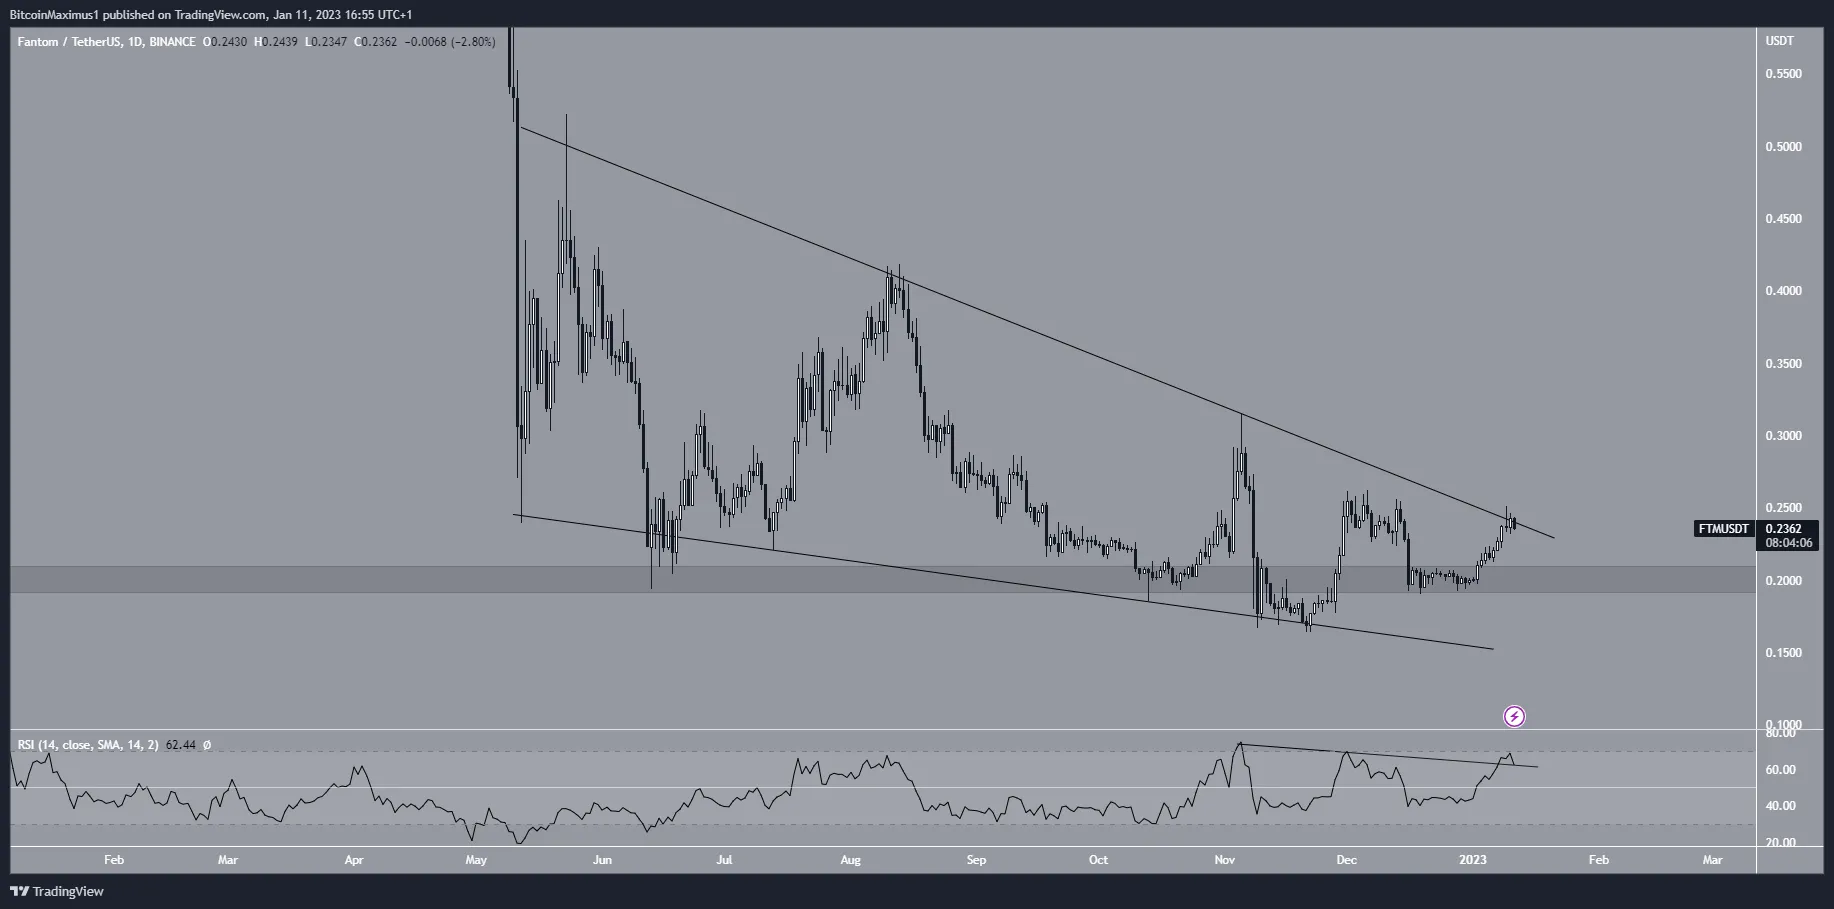
The two main reasons for this are the creation of a bullish pattern and bullish readings in the RSI. The Fantom price has traded inside a descending wedge since the beginning of May. It is currently in the process of breaking out. Doing so would go a long way in confirming the bullish reversal from the weekly time frame and have positive implications for the future price.
Next, the daily RSI is increasing and broke out from a descending resistance line (black line). This is another sign of a bullish trend.
As a result, a breakout from the wedge would confirm that the bullish reversal has begun for the FTM token.
To conclude, the most likely FTM price forecast is a breakout from the wedge in the daily time frame and an increase toward the $0.40 resistance area. A close below $0.20 would invalidate this bullish hypothesis.
For BeInCrypto’s latest crypto market analysis, click here.
Disclaimer
BeInCrypto strives to provide accurate and up-to-date information, but it will not be responsible for any missing facts or inaccurate information. You comply and understand that you should use any of this information at your own risk. Cryptocurrencies are highly volatile financial assets, so research and make your own financial decisions.


Be the first to comment