In this article we will analyze the trend of some major crypto: Bitcoin, Ethereum and Binance Coin (BNB).
Crypto: Bitcoin, Ethereum and BNB prices analysis
Bitcoin (BTC) Analysis
Bitcoin’s price was marked-down on Sunday by sellers and when the day’s candle was painted, BTC’s price was -$410.5.
2022 is beginning to wind down and another new week of price analyses is upon us. This week we’re beginning with the BTC/USD 1D chart below from Tolberti. BTC’s price is trading between the 1 fibonacci level [$14,418.00] 0.618 [$17,113.01], at the time of writing.
Bullish BTC market participants have been battered over the last month after another failed attempt to break the $24k level. Since being rejected at the $24k level, BTC’s price has lost 29.36% of its value.
If bullish BTC traders want to mark some sort of reversal and signal that the bottom of the bear market may have been made already, they’ll need to regain the 0.618 fib level soon. There’s not a lot of historical price action to suggest the $16k level is a safe place for bulls to accumulate in the short-term. Above the 0.618 fib level is a full retracement at 0 [$21,473.00].
Bearish traders conversely have been in absolute control of the market over the last few weeks. Their targets to the downside are the 1 fib level followed by the 1.618 [$10,058.01].
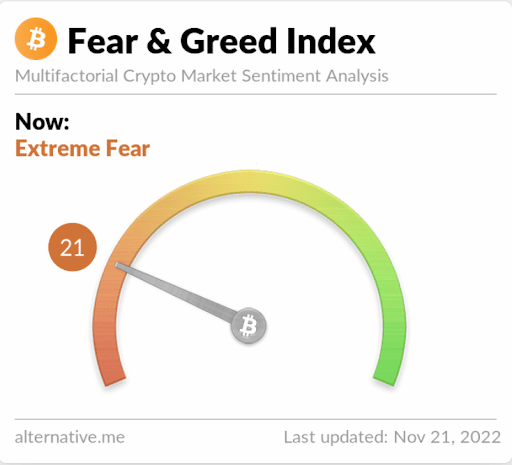
The Fear and Greed Index is 21 Extreme Fear and is -3 from Sunday’s reading of 24 Extreme Fear.

Bitcoin’s Moving Averages: 5-Day [$16,629.31], 20-Day [$18,832.3], 50-DAY [$19,257.67], 100-Day [$20,521.94], 200-Day [$27,913.03], Year to Date [$29,636.87].
BTC’s 24 hour price range is $16,180-$16,753.3 and its 7 day price range is $15,931.39-$17,044.68. Bitcoin’s 52 week price range is $15,603-$60,047.
The price of Bitcoin on this date last year was $58,790.
The average price of BTC for the last 30 days is $18,881.7 and its -14.4% over the same interval.
Bitcoin’s price [-2.46%] closed its daily candle worth $16,289.9 and in red figures for the second time in three days on Sunday.
Ethereum Analysis
The second largest cryptocurrency by market capitalization also was pushed lower by bearish traders on Sunday and when traders-settled up on ETH to close the day it was -$74.79.
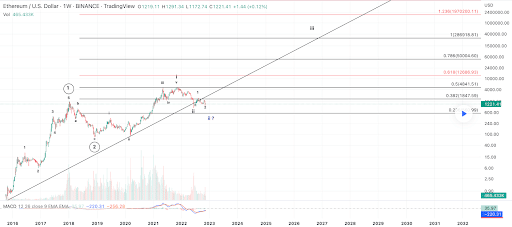
The ETH/USD 1W chart below by maikisch is the second chart we’re analyzing for this Monday. At the time of writing, ETH’s price is trading between the 0.236 [$560.99] and 0.382 fib level [$1,847.59].
The primary target on the weekly time frame for Ether bulls is the 0.382 fib level followed by 0.5 [$4,841.51], 0.618 [$12,686.93], and 0.786 [$50,004.6].
Bearish ETH traders are again trying to send ETH’s price below the $1k level with a primary target of ETH’s 12-month low of $883.62 followed by the 0.236 fibonacci level.

Ether’s Moving Averages: 5-Day [$1,218.61], 20-Day [$1,400.44], 50-Day [$1,378.6], 100-Day [$1,469.74], 200-Day [$1,943.23], Year to Date [$2,083.84].
ETH’s 24 hour price range is $1,125.86-$1,227.07 and its 7 day price range is $1,125.86-$1,277.08. Ether’s 52 week price range is $883.62-$4,778.
The price of ETH on this date in 2021 was $4,268.16.
The average price of ETH for the last 30 days is $1,388.33 and its -10.58% over the same span.
Ether’s price [-6.14%] finished its daily session on Sunday valued at $1,142.88 and in red digits for the first time in four days.
Binance Coin Analysis
Binance Coin’s price was the second worst performer of the lot today and finished Sunday’s candle -$8.20.
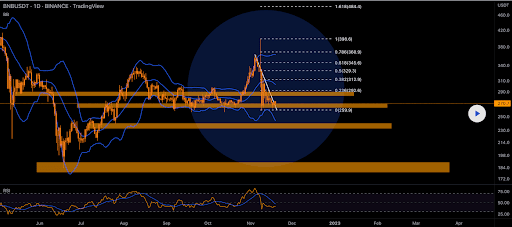
The BNB/USD 1D chart below from MonoCoinSignal is the final chart we’re examining today. At the time of writing, BNB’s price is trading between the 0 fib level [$259.9] and 0.236 [$292.6].
The overhead targets for those that are longing BNB are, 0.236, 0.382 [$312.9], 0.5 [$329.3], 0.618 [$345.6], 0.786 [$368.9], and the 1 fibonacci level [$398.6].
The primary aim contrariwise for bearish BNB traders is the 0 fib level. The next major level of inflection below the 0 fib level is the $184.1 level which is BNB’s 12-month low.

Binance Coin’s Moving Averages: 5-Day [$16,629.31], 20-Day [$18,832.3], 50-Day [$19,257.67], 100-Day [$20,521.94], 200-Day [$27,913.03], Year to Date [$29,636.87].
Binance Coin’s 24 hour price range is $261.4-$273.8 and its 7 day price range is $261.4-$288.22. BNB’s 52 week price range is $184.1-$657.7.
Binance Coin’s price on this date last year was $585.20.
The average price of BNB over the last 30 days is $295.27 and its -1.57% over the same stretch.
Binance Coin’s price [-3.01%] closed Sunday worth $264.40 and in negative figures for the fifth time out of the last six days.


Be the first to comment