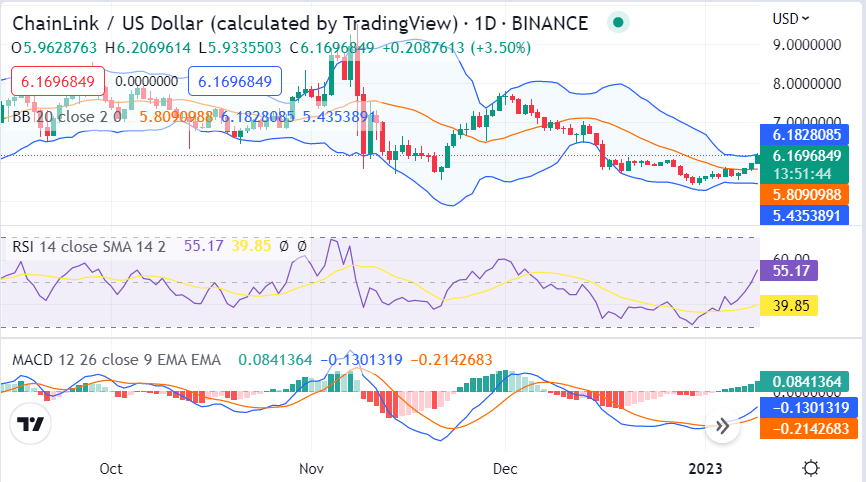
Chainlink price analysis shows the coin is bullish today, as the price surged to $6.14 after a strong bullish momentum. LINK is currently retracing to the support level of $5.79, which if breached could see the altcoin decline further. Early today the LINK/USD pair tested $5.79 support, however, bulls defended the level and pushed the price higher. As of now, LINK is trading at $6.14 and is facing resistance at $6.16. If the buyers manage to push the price above this level, then LINK could target $6.35 and $6.45 resistance levels in the near term.
The LINK/USD is up by 6.02% in the past 24 hours and is showing a buying sentiment. Additionally, most of the top cryptocurrencies are in the green today, which indicates that LINK could continue to rise in the coming days. Bitcoin is up by 1.66% and Ethereum is up by 4.26%, and some altcoin like Solana is up by 20.68%.
LINK/USD 1-day price chart: Bulls struggle to make a breakthrough above $6.14
The 1-day Chainlink price analysis shows the price has increased significantly today as the bulls regained control. LINK/USD is trading at $6.14 at the time of writing. The trading volume also increased to $233.2 million, which indicates that buyers are becoming more active in the market. The market cap of LINK is $3.13 billion, and the coin is ranked 22nd in terms of market capitalization.

The volatility indicator again shows signs of an increase in volatility as the extreme ends of the Bollinger bands expand. The Upper Bollinger band is at $6.18 while the lower band is at $5.43, indicating that LINK could make a further correction in the near term. The relative strength index (RSI) is on an upwards curve indicating the buying activity in the market. Currently, RSI is present at 39.85. The MACD has also moved in the bullish zone, and a golden cross appears on the chart, which is a sign of further price appreciation.
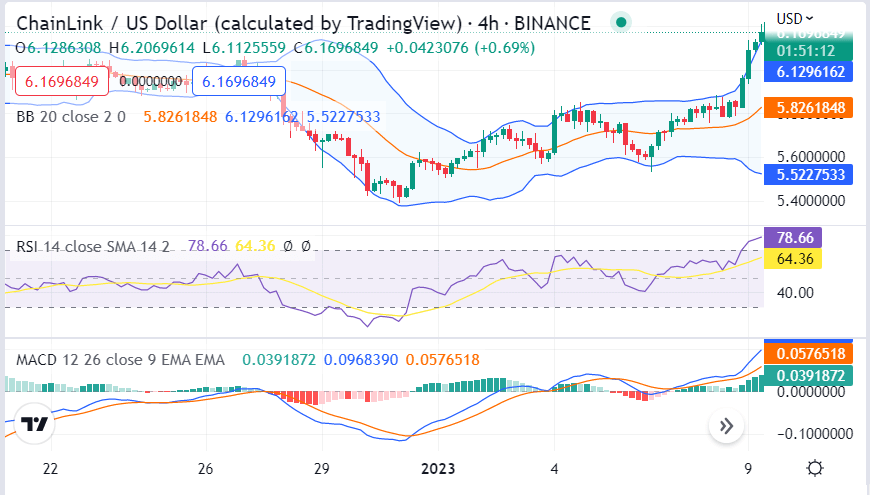
Chainlink price analysis 4-hour chart: LINK/USD continues to move above $6.14
The 4-hour Chainlink price analysis shows LINK corrected during the last four hours of the previous session and made a high jump at the start of the current session, LINK still continues upside at the press time. The price is trading at $6.14 and showing a buying sentiment in the market.

The volatility is high on the 4-hour chart, and the Bollinger bands are expanded onto a larger area. The LINK price is trading just below the upper band, at $6.12, While the lower band is present at the $5.522 level. The RSI is currently at 64.36 and has formed an ascending pattern on the chart, indicating more upside in the market. The MACD also shows buying sentiment with a bullish crossover.
Chainlink price analysis conclusion
Chainlink price analysis suggests the coin has made good progress today as it reached $6.14, and there are ample chances of bulls taking the price further higher in the coming hours. We expect LINK to continue higher for today and then retrace for a day before aiming for the next crucial resistance at $6.16.


Be the first to comment