

The Chainlink (LINK) price prediction for the long-term is bearish due to the ongoing downward movement, which could accelerate if a bounce does not transpire soon.
The Chainlink price is in the process of breaking down from a 230-day support area, something that could trigger a sharp downward movement. While the LINK/BTC price action is not bullish, it shows much better chances of a reversal when compared to its USDT counterpart.
Chainlink Long-Term Price Prediction: $4.40 in Sight
The Chainlink price has fallen below a descending resistance line since Nov. 8. More recently, the line caused a rejection on Dec. 13 (red icon). This led to a minimum price of $5.45 on Dec. 29.
Currently, the LINK price is trading just below the $5.80 horizontal support area. Additionally, the Dec. 28 close of $5.67 was the lowest since June 2020. The decrease continued over the next 24 hours.
Next, the daily RSI broke down from its bullish divergence trendline (green) and validated it as resistance afterward (red circle).
All of these are bearish developments, strengthened by the fact that the $5.80 support area has been in place for 230 days. Therefore, a breakdown from it could catalyze a sharp fall toward the $4.40 support area.
On the other hand, a breakout from the descending resistance line could lead to a relief rally. Due to the aforementioned bearish readings, this Chainlink price forecast does not seem likely.
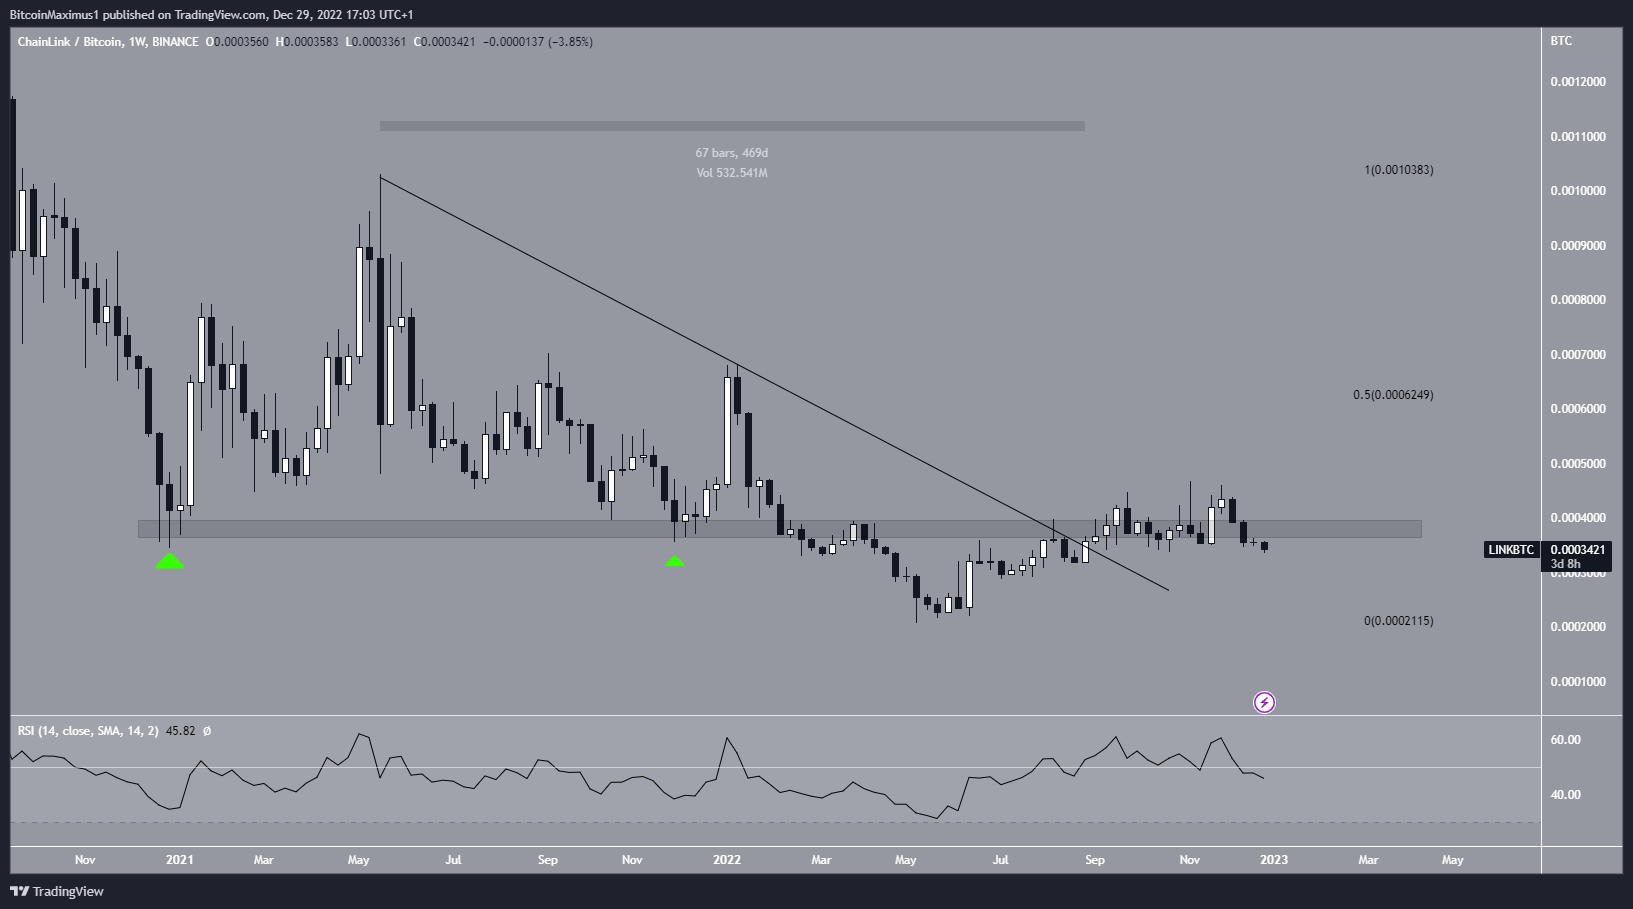
LINK/BTC is at Make-or-Break Level
Despite the bearish LINK price analysis from the USD pair, the technical analysis for the LINK/BTC pair gives hope for a potential bullish reversal. The main reason for this is the breakout from a descending resistance line that had been in place for 469 days. Afterward, LINK began an upward movement leading to a high of 46,780 satoshis.
Despite the breakout, the LINK price is struggling to move above the 38,000 satoshi horizontal area. This crucial level previously acted as support on Dec. 2020 and 2021 (green icon). Moreover, the weekly RSI is right at 50 and an upward movement would likely cause it to increase above this level. Therefore, the LINK price must move above 38,000 satoshis for the trend to be bullish.
As a result, if the LINK token price gets rejected from the 38,000 satoshi resistance area, it could lead to a downward movement toward 23,000 satoshis. On the other hand, moving above the 38,000 satoshi area could lead to a bullish future price and an increase of more than 100%, leading to highs near 62,500 satoshis. This would make the Chainlink long-term price prediction bullish.
To conclude, the LINK/USDT pair is considerably more bearish than LINK/BTC due to its bearish price movement and breakdown from horizontal support. A breakout from the descending resistance line would invalidate this bearish LINK price analysis, while the reaction to the 38,000 satoshi resistance area could determine the LINK/BTC trend.
For BeInCrypto’s latest crypto market analysis, click here.
Disclaimer
BeInCrypto strives to provide accurate and up-to-date information, but it will not be responsible for any missing facts or inaccurate information. You comply and understand that you should use any of this information at your own risk. Cryptocurrencies are highly volatile financial assets, so research and make your own financial decisions.


Be the first to comment