

- Cardano and Solana decoupled from Bitcoin, Ethereum and crypto ecosystem, yielding double-digit gains overnight on January 8.
- On-chain indicators like social dominance and daily active addresses signaled a bullish trend reversal for both.
- Litecoin’s correlation with Bitcoin and Ethereum is declining, the altcoin may be preparing for an explosive price rally.
Cardano and Solana, two competitors of the smart contract blockchain network Ethereum recently witnessed massive breakouts in their prices. On-chain indicators like social dominance and network activity in ADA and SOL signaled a bullish trend reversal before the tokens posted double-digit price rallies. The next altcoin to follow ADA and SOL in this trend is Litecoin, bulls target a 22% rally in the payment token.
Find out more about three key developments that the Cardano community is looking forward to in 2023 here.
Also read: Solana network witnesses spike in daily activity, bounces back 3x pre-FTX collapse
Cardano and Solana prices yield upwards of 20% gains for holders in 24-hour period
Cardano, the Ethereum-killer smart contract blockchain network and the proof-of-stake layer-1 blockchain Solana yielded 20% gains for holders in a 24-hour period, from January 8 to January 9, 2023. Cardano and Solana’s correlation with large market capitalization cryptocurrencies Bitcoin and Ethereum nosedived, the altcoins decoupled and witnessed a bullish breakout.
The correlations matrix below shows the assets’ correlation coefficient with BTC and ETH:
Correlations matrix from cryptowat.ch
As seen in the table above, Bitcoin and Ethereum are strongly correlated while altcoins like Litecoin, XRP, Cardano and Solana have decoupled or witnessed a decline in correlation. Litecoin’s correlation with Bitcoin plummeted to 0.63.
Three on-chain metrics that signaled a bullish breakout in Cardano and Solana
On-chain metrics like social dominance, network activity and the ratio of daily on-chain transaction volume in profit to loss signaled the trend reversal in Cardano and Solana, based on data from crypto aggregator Santiment.
Daily active addresses on a cryptocurrency’s network reflect the volume of activity on the blockchain. A steady increase in daily active addresses indicates an upcoming trend reversal. Just as an increase in whale activity and large value transactions signals a spike in selling pressure and a bearish trend reversal, a spike in daily active addresses and high network activity is synonymous with an upcoming bullish breakout in an asset.
Social dominance of an asset, is a metric that uses big data, gleaned from social media forums where the asset is being mentioned. A spike in social dominance happens when it is mentioned a lot in social media.
The ratio of daily on-chain transaction volume in profit to loss is another metric used by analysts. It tracks the aggregate amount of coins or tokens across all transactions on the network that moved in a given interval. If there is a lower volume of transactions that resulted in losses compared to gains, the ratio increases, and vice versa for gains. The chart below shows Cardano price appreciating alongside a steadily climbing ratio of daily on-chain transaction volume in profit to loss.
The chart also shows the number of daily active addresses on the network rising at the same time.
%20[10.11.43,%2009%20Jan,%202023]-638088475335787715.png)
Cardano on-chain metrics
The number of daily active addresses (dark green bars) on the network steadily rose in the last week of December along with price. This was also coupled with a rise in social dominance (blue line) and a steadily rising ratio of transactions realizing profits (light green bars), as well as Cardano price hitting a monthly high of $0.3395.
Solana flipped the narrative from dead project to 22% daily gains
Samuel Bankman-Fried’s FTX exchange collapse, and the migration of NFT projects and dApps from Solana blockchain to Polygon and Ethereum fueled a bearish narrative among SOL holders. The Ethereum-killer altcoin wiped out its gains from 2022 and suffered a steep decline in its price in November 2022.
Solana has flipped the narrative and recovered from a “dead project” to a proof-of-stake blockchain with high development activity and consistent social dominance and volume. The altcoin observed a huge spike in its trade volume after a 22% decoupling from the crypto market.
%20[10.24.36,%2009%20Jan,%202023]-638088475736421452.png)
Solana on-chain metrics from Santiment
As seen in the chart above, Solana price has climbed on the back of rising trade volume, popularity among traders on social media platforms and social dominance that hit a peak in the second half of December 2022.
With its declining correlation with BTC and ETH, Litecoin could follow Cardano and Solana higher.
Litecoin price gears up for a 22% rally
Litecoin, the payment token and Bitcoin-alternative, is on track for a bullish breakout from an ascending channel. The recent crossover of the 50-day Exponential Moving Average (EMA) above the 200-day EMA, confirms a bullish golden cross signal – the altcoin is climbing consistently in an ascending channel.
A breakout above the upper trendline could push LTC to key resistance at $85.03 and the bullish target at $101.50, a key resistance level from the monthly price chart. As seen in the chart below, Litecoin could witness a 22% rally after the bullish thesis is validated.
Litecoin’s bullish breakout could be temporary and represent a possible blow out or exhaustion move higher before a reversal back down, so traders should approach with caution.
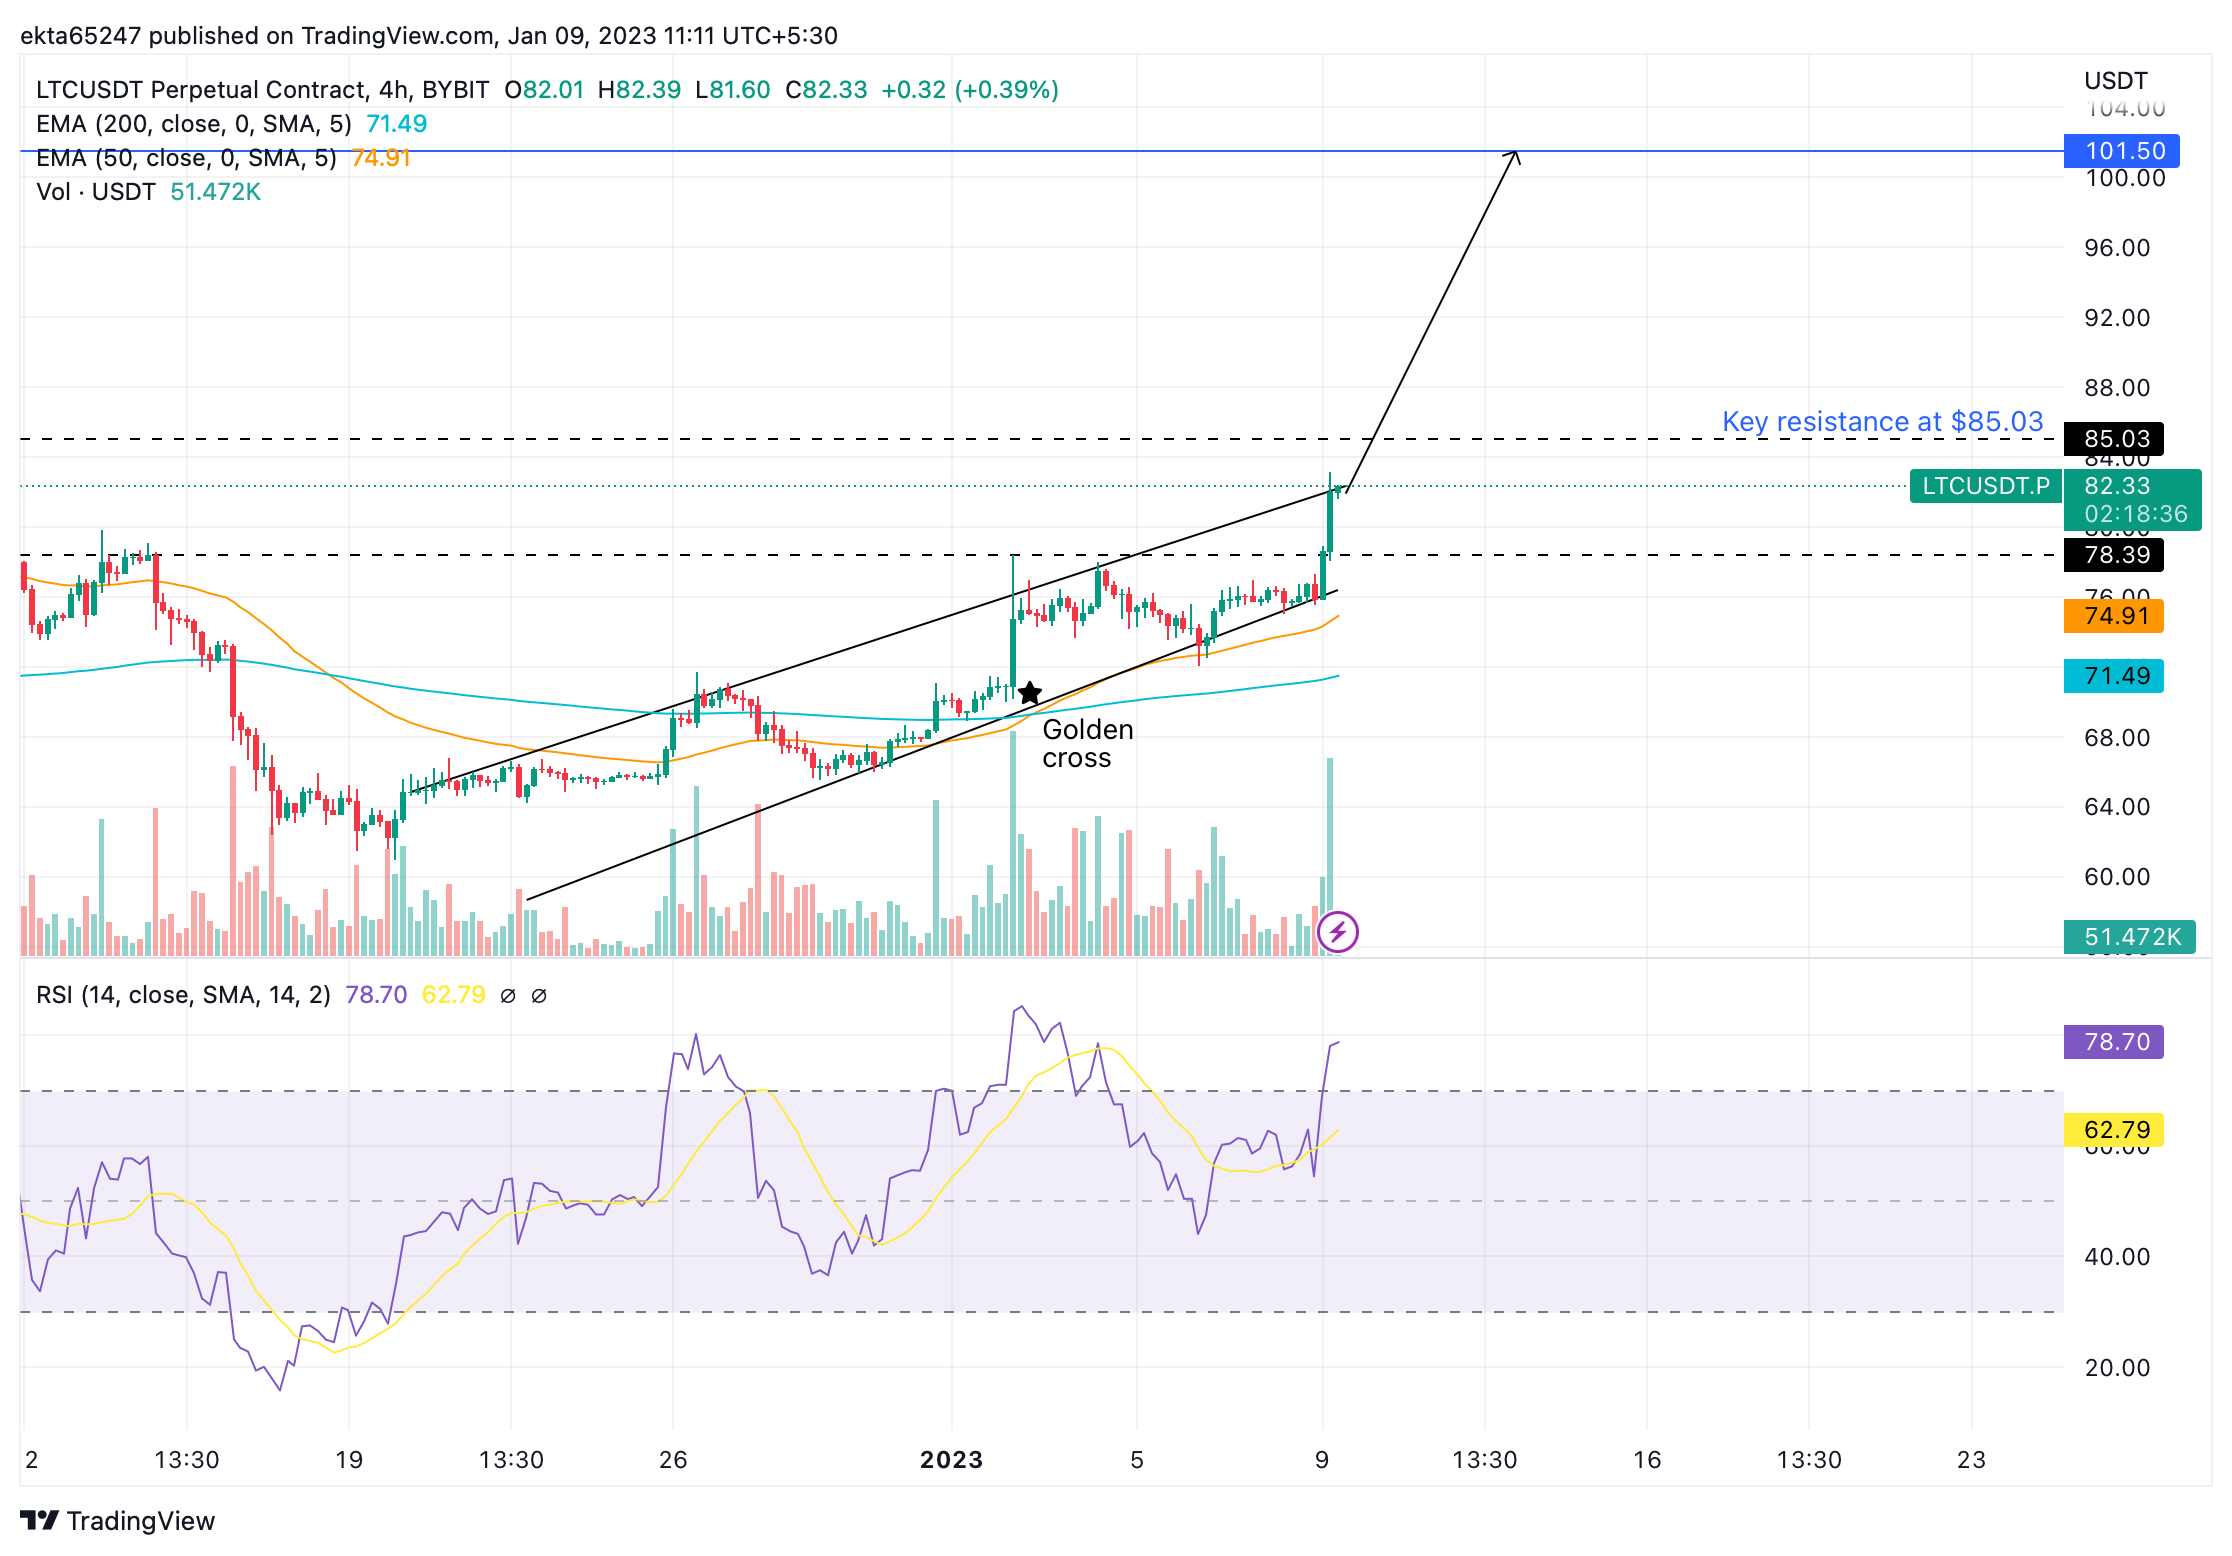
LTCUSDT Perpetual Contract
The Relative Strength Index (RSI), a momentum indicator, however, reads 78.70, signaling that Litecoin is overbought. This is a signal to bulls not to add anymore longs, and a potential warning flag. A decline below the 70 level would be a signal to holders to sell their longs and flip short.
If price declines below the lower trendline of the channel, or the two exponential moving averages at $74.91 and $71.90 this could invalidate the bullish thesis for Litecoin.


Be the first to comment