
Disclaimer: The opinion expressed here is not investment advice – it is provided for informational purposes only. It does not necessarily reflect the opinion of U.Today. Every investment and all trading involves risk, so you should always perform your own research prior to making decisions. We do not recommend investing money you cannot afford to lose.
Bulls are losing their initiative as the rates of most of the coins are in the red zone.
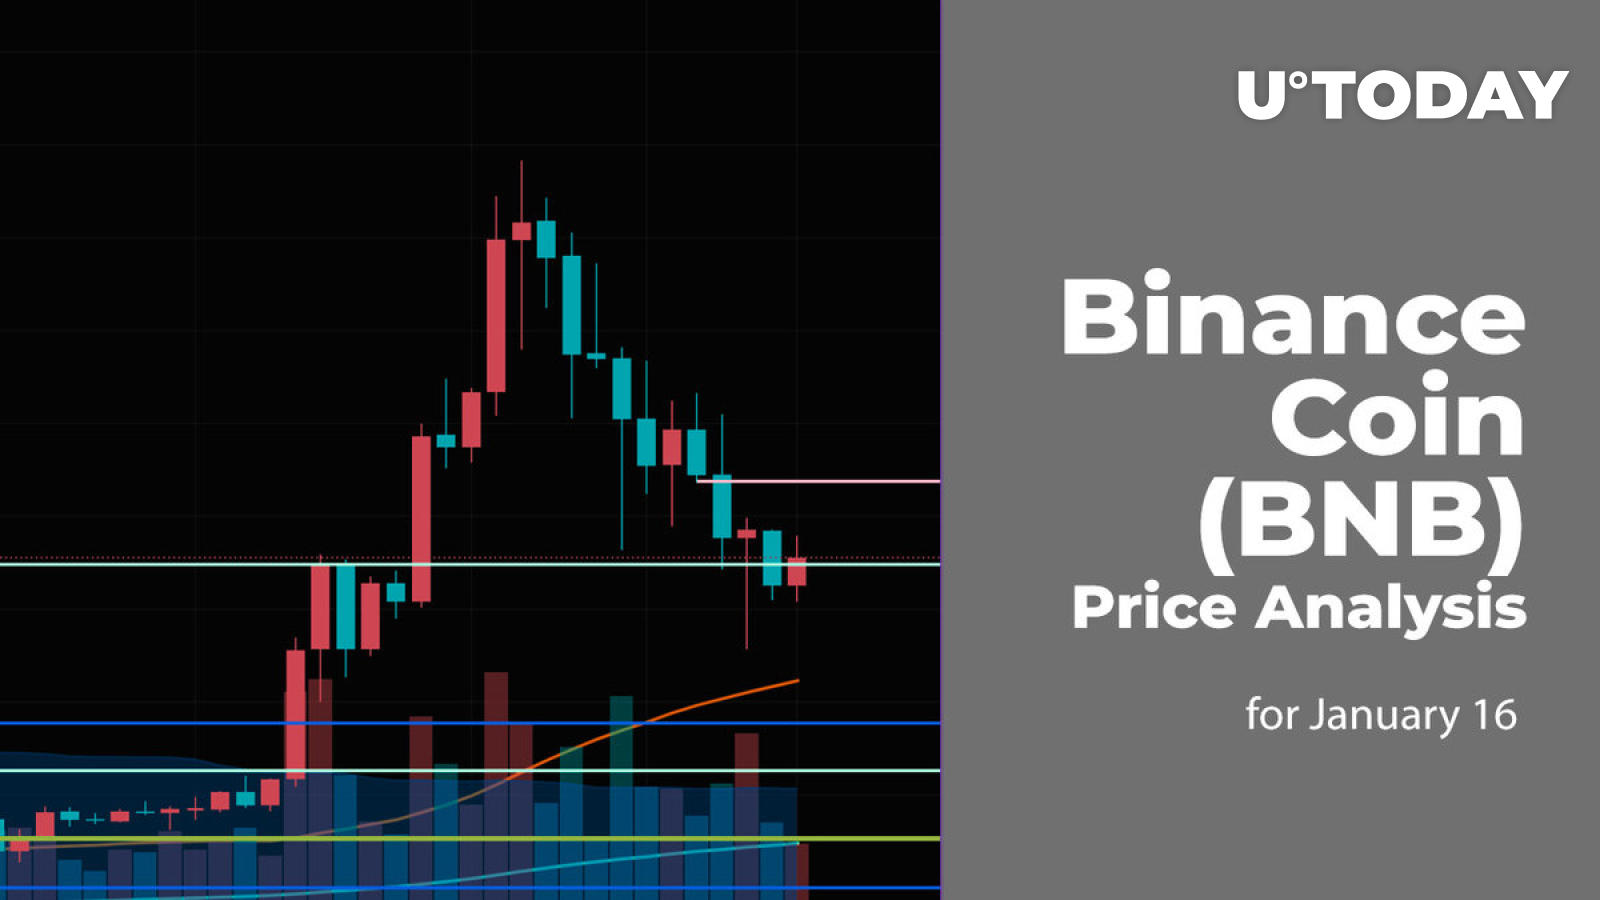
BNB/USD
Binance Coin (BNB) could not withstand bears’ pressure, going down by 1.26% over the last 24 hours.

On the hourly chart, the price of Binance Coin (BNB) has broken the support at $296 and keeps declining. In this case, the more likely scenario is the ongoing drop to the $290 zone.
Thus, the selling volume is rising, which means that bears are not going to give up so easily.

On the daily chart, the price of Binance Coin (BNB) has failed to fix above the vital $300 zone. Currently, one should pay attention to the daily closure. If it happens below yesterday’s low at $291.8, the decline may lead to the test of the support at $287.7.

The situation is more bearish on the daily time frame against Bitcoin (BTC), as the rate keeps decreasing after the breakout of the support at 0.01433. If buyers cannot seize the initiative shortly, the downward move may continue to the 0.014 zone.
BNB is trading at $295.8 at press time.


Be the first to comment