

- Binance Coin price deals with choppy market forces before bleeding continues.
- With a bearish rectangle pattern on the daily chart taking shape, BNB price could retest the $226 level.
- Investors (whales) will keep off BNB until the stubborn selling pressure is shed.
Binance Coin price may have eased off the selling pressure after bouncing off support at $260, but investors seem skeptical that this will translate into an uptrend. Its technical outlook appears shaky, forecasting another correction to $226.
These factors could drive Binance Coin price to $226
The supply held by addresses between 10,000 and 100,000 increased from 3.14% in July, topping 3.33% in mid-August before falling to 3.21%. BNB’s run-up to highs near $300 was backed by an increase in supply held by the cohort to 3.33%.
However, with the chart below on a negative gradient, the near-term future for Binance Coin price remains bleak. In other words, as whales shun the token, selling pressure mounts – thus increasing the chances of an extended downtrend.
Binance Coin Supply Distribution
The BNB price technical outlook has not improved after the freefall from highs close to $300. A rectangle pattern on the daily chart confirms an untradeable choppy market.
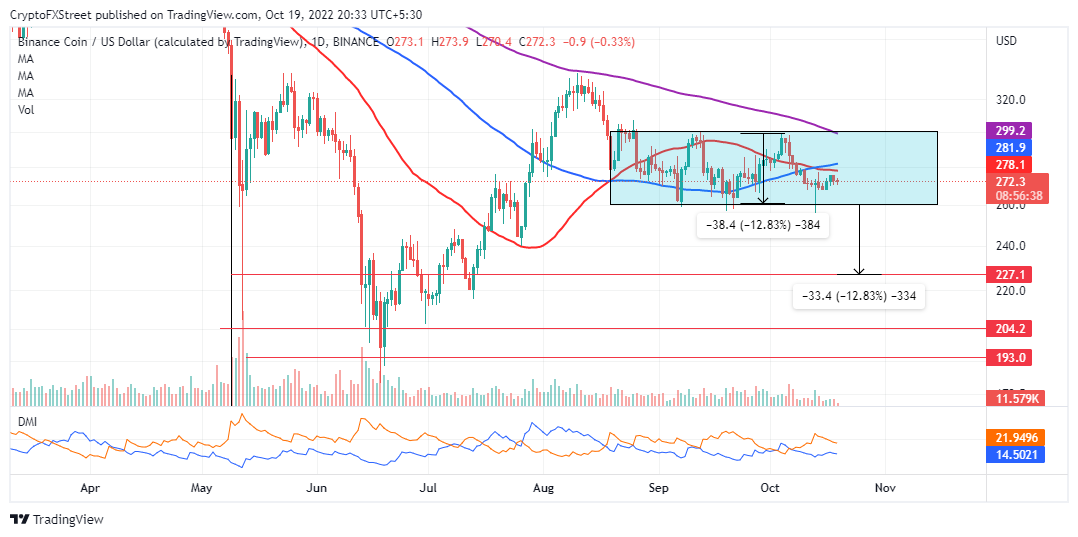
BNB/USD daily chart
A bearish rectangle comes into play in the midst of a downtrend as is the case with Binance Coin, given the move that preceded its formation was a down-leg from the August peak. Sellers often recapture the asset after taking a breather, hence the foreshadowed move lower. Normally the length of the breakout equals the height of the rectangle extrapolated lower forecasting a drop to $226. To short BNB, traders must wait for a confirmed move below the rectangle baseline before activating their orders.
Adding credence to the possibility of another leg down to $226 is the Directional Movement Index (DMI). A sell signal will surface as the 12-day EMA (Exponential Moving Average), orange, flips below the 26-day EMA, blue.
On the other hand, Binance Coin price will temporarily avoid the 13.17% bearish move below the breakout point if bulls manage to push above the 100-day SMA (Simple Moving Average), blue, at $278 and the 50-day SMA, red, holding at $281.
A breakout to the upside cannot be ruled out. Stubbornly bullish investors could consider $300 at the rectangle ceiling or $320 at the August highs as take-profit positions.


Be the first to comment